


Chủ đề: Tuyệt Chiêu AmiBroker
Hybrid View
-
20-02-2011 08:55 PM #1
- Ngày tham gia
- Oct 2003
- Bài viết
- 365
- Được cám ơn 215 lần trong 148 bài gởi

Em thấy nó giống với dạng như RMO hơn
-
21-02-2011 08:02 AM #2
- Ngày tham gia
- Oct 2009
- Bài viết
- 1,925
- Được cám ơn 617 lần trong 428 bài gởi
Các bác nhận xét đều đúng cả. Nói chung các chỉ báo đều có những nhóm nhất định thôi chứ không thể mỗi cái đều khác nhau quá xa được
/// Chaloke Reaction Trend System ///
XX=(H+L+C)/3;
BB=2*XX-H;
SS=2*XX-L;
HBOP=2*XX-2*L+H;
LBOP=2*XX-2*H+L;
color=IIf(BarsSince(Cross(H,Ref(HBOP,-1)))>
BarsSince(Cross(Ref(LBOP,-1),L)),colorRed , colorBrightGreen);
Plot(C,"",Color,64);
Plot(XX,"",colorYellow);
Plot(BB,"",colorLime);
Plot(SS,"",colorPink);
Plot(HBOP,"",colorGreen);
Plot(LBOP,"",colorDarkRed);
Title=Name()+" "+Date()+" "+EncodeColor(colorSkyblue)+" Chaloke RTS System "+EncodeColor(colorYellow)+" Vol="+NumToStr(Volume,1.0)+" "+" O="+Open+" H="+HHV(H,1)+" L="+LLV(L,1)+"
Close="+ Close+""+"("+numtostr((Close-ref(C,-1))/ref(c,-1)*100,1.2)+" %)";
-
Có 2 thành viên đã cám ơn tigeran :
mrluckyguy0 (13-02-2012), tronghoangfi (04-10-2012)
-
23-02-2011 04:29 PM #3
- Ngày tham gia
- Oct 2009
- Bài viết
- 1,925
- Được cám ơn 617 lần trong 428 bài gởi
Mình gửi thêm một công thức mà các cao thủ AmiBroker không thể thiếu trong bí kíp
//|------------------------------------------------------------------
//|SECTION 21 - default buy, sell, short and cover rules. They are added to the PatternExplorer signals.
//|------------------------------------------------------------------
def_Buy = 1;
def_Sell = 1;
def_Short = 1;
def_Cover = 1;
//|------------------------------------------------------------------
//|------------------------------------------------------------------
//|SECTION 22 - Use Param from Chart
//|------------------------------------------------------------------
// NOT all parameters are possible. Currently only sensitivity is possible.
def_UseFromChart = 1;
//|------------------------------------------------------------------
//-------------------------------------------------------------------------------------------------------------------------------------
//SECTION 23 - Add custom code before PatternExplorer code.
//-------------------------------------------------------------------------------------------------------------------------------------
//The following code allows you to add any custom code to any tool. Just use the Formula names as displayed in the workspace.
procedure AddCustomCodeBeforePE()
**
if(FormulaName == "PE - SI Relative Strength")
**
def_Filter = 1;//Filter set to 1 because common filter conditions are mostly not useful in the composite indicators. }
}
else
if(FormulaName == "PE - SI Trend")
**
def_Filter = 1;//Filter set to 1 because common filter conditions are mostly not useful in the composite indicators.
}
else
if(FormulaName == "PE - Candlesticks")
**
// AddColumn(MA(C, 5) > MA(C, 20), "MA(C, 5) > MA(C, 20)", 1.0);// Example to add a column before all the PatternExplorer columns, only in the Candlestick tool.
// Plot(PeTaio(), "PeTaio", colorBlue, 1+styleOwnScale, -100, 100);//Example to overlay the TAIO indicator over the Price Chart in the Candlestick tool.
}
else
**
// do anything
}
}
//-------------------------------------------------------------------------------------------------------------------------------------
// -------------------------------------------------------------------------------------------------------------------------------------
// SECTION 24 - Add custom code after PatternExplorer code.
// -------------------------------------------------------------------------------------------------------------------------------------
procedure AddCustomCodeAfterPE()
**
if(FormulaName == "PE - Alert 1 - Price")
**
// AddColumn(H == HHV(H, 20), "H == HHV(H, 20)", 1.0);// Example to add a column after PatternExplorer columns in PE - Alert 1 - Price.
}
// AddColumn(RSI() < 30, "RSI() < 30");// Example to add a column after PatternExplorer columns in all tools.
}
//-------------------------------------------------------------------------------------------------------------------------------------
//V3 - End of settings - Caution: Never change or remove this line !
-
Những thành viên sau đã cám ơn :
tronghoangfi (04-10-2012)
-
02-03-2011 08:21 AM #4
- Ngày tham gia
- Aug 2010
- Bài viết
- 648
- Được cám ơn 325 lần trong 218 bài gởi
Cái hệ thống phân tích kỹ thuật này xài thế nào vậy bác. Chứ code trong AmiBroker không em không hiểu nổi
Bác có cái nào tương tự trong MetaStock không
-
03-03-2011 08:20 AM #5
- Ngày tham gia
- Oct 2009
- Bài viết
- 1,925
- Được cám ơn 617 lần trong 428 bài gởi
Không có bác ạ. Đâu phải cái nào cũng có đồng thời trong hai phần mềm phân tích kỹ thuật đâu. Tùy cái chứ Gửi bởi tradingpro8x

-
10-03-2011 10:53 AM #6
- Ngày tham gia
- Aug 2010
- Bài viết
- 648
- Được cám ơn 325 lần trong 218 bài gởi
Căng nhỉ em toàn phân tích kỹ thuật trên Metastock thôi
-
12-03-2011 05:30 PM #7
- Ngày tham gia
- Oct 2003
- Bài viết
- 365
- Được cám ơn 215 lần trong 148 bài gởi
Thế là bác bị bất lợi rùi. Dân phân tích kỹ thuật đỉnh là phải xài cả hai cùng lúc
Em gửi các bác một chỉ báo mới này. Cái này xài cho AmiBroker nhé
SetChartOptions(0,chartShowArrows|chartShowDates);
_SECTION_BEGIN("Vol-bands");
Vf=Param("V-b Values",0.0146,-0.0001,0.1,0.0001);
P1 = ValueWhen(TimeNum() == 095500, Open);
T0 = P1+(P1*0.25*Vf);
B0 = P1-(P1*0.25*Vf);
T1 = P1+(P1*0.5*Vf);
B1 = P1-(P1*0.5*Vf);
T2 = P1+(P1*1*Vf);
B2 = P1-(P1*1*Vf);
T3 = P1+(P1*1.28*Vf);
B3 = P1-(P1*1.28*Vf);
T4 = P1+(P1*1.5*Vf);
B4 = P1-(P1*1.5*Vf);
T5 = P1+(P1*2*Vf);
B5 = P1-(P1*2*Vf);
T6 = P1+(P1*2.5*Vf);
B6 = P1-(P1*2.5*Vf);
T7 = P1+(P1*3*Vf);
B7 = P1-(P1*3*Vf);
hts = Param ("Text Shift", -55,-150,150,1);
numbars = LastValue(Cum(Status("barvisible")));
fraction= IIf(StrRight(Name(),3) == "", 3.2, 3.2);
Today = LastValue(Day()) ;
starttime = ParamTime( "Start Time", "09:55" );
endtime = ParamTime( "End Time", "10:00" );
tn = TimeNum();
timecond = tn >= starttime AND tn <= endtime;
firstBarOfDay = timecond ;
firstBarOfDay = firstBarOfDay - Ref( firstBarOfDay, -1 );
Cb=ParamToggle("0.25 ","NO|YES",1);
Cb1=ParamToggle("0.50","NO|YES",1);
Cb2=ParamToggle("1.0 ","NO|YES",1);
Cb3=ParamToggle("1.28","NO|YES",1);
Cb4=ParamToggle("1.5 ","NO|YES",0);
Cb5=ParamToggle("2.0 ","NO|YES",0);
Cb6=ParamToggle("2.5 ","NO|YES",0);
Cb7=ParamToggle("3.0 ","NO|YES",0);
if(Cb==1)**
Plot(IIf( tn > endtime , t0, Null ) ,"",7, styleLine+ styleNoLabel);
PlotText("0.25= " + WriteVal(T0,fraction),LastValue(BarIndex())-(numbars/hts),LastValue (T0,1) , 2);
Plot(IIf( tn > endtime , b0, Null ),"",7, styleLine+ styleNoLabel);
PlotText("0.25= " + WriteVal(B0,fraction),LastValue(BarIndex())-(numbars/hts),LastValue (B0,1) , 2);
}if(Cb1==1)**
Plot(IIf( tn > endtime , t1, Null ),"",48, styleDashed+ styleNoLabel);
PlotText("0.50= " + WriteVal(T1,fraction),LastValue(BarIndex())-(numbars/hts),LastValue (T1,1) , 2);
Plot(IIf( tn > endtime , b1, Null ),"",48, styleDashed+ styleNoLabel);
PlotText("0.50= " + WriteVal(B1,fraction),LastValue(BarIndex())-(numbars/hts),LastValue (B1,1) , 2);
}if(Cb2==1)**
Plot(IIf( tn > endtime , t2, Null ),"",3, styleLine+ styleNoLabel);
PlotText("1.00= " + WriteVal(T2,fraction),LastValue(BarIndex())-(numbars/hts),LastValue (T2,1) , 2);
Plot(IIf( tn > endtime , b2, Null ),"",3, styleLine+ styleNoLabel);
PlotText("1.00= " + WriteVal(B2,fraction),LastValue(BarIndex())-(numbars/hts),LastValue (B2,1) ,2);
}if(Cb3==1)**
Plot(IIf( tn > endtime , t3, Null ),"",51, styleDashed+ styleNoLabel);
PlotText("1.28= " + WriteVal(T3,fraction),LastValue(BarIndex())-(numbars/hts),LastValue (T3,1) , 2);
Plot(IIf( tn > endtime , b3, Null ),"",51, styleDashed+ styleNoLabel);
PlotText("1.28= " + WriteVal(B3,fraction),LastValue(BarIndex())-(numbars/hts),LastValue (B3,1) , 2);
}if(Cb4==1)**
Plot(IIf( tn > endtime , t4, Null ),"",5, styleDashed+ styleNoLabel);
PlotText("1.50= " + WriteVal(T4,fraction),LastValue(BarIndex())-(numbars/hts),LastValue (T4,1) , 2);
Plot(IIf( tn > endtime , b4, Null ),"",5, styleDashed+ styleNoLabel);
PlotText("1.50= " + WriteVal(B4,fraction),LastValue(BarIndex())-(numbars/hts),LastValue (B4,1) , 2);
}if(Cb5==1)**
Plot(IIf( tn > endtime , t5, Null ),"",4, styleDashed+ styleNoLabel);
PlotText("2.00= " + WriteVal(T5,fraction),LastValue(BarIndex())-(numbars/hts),LastValue (T5,1) , 2);
Plot(IIf( tn > endtime , b5, Null ),"",4, styleDashed+ styleNoLabel);
PlotText("2.00= " + WriteVal(B5,fraction),LastValue(BarIndex())-(numbars/hts),LastValue (B5,1) , 2);
}if(Cb6==1)**
Plot(IIf( tn > endtime , t6, Null ), "",47, styleDashed+ styleNoLabel);
PlotText("2.50= " + WriteVal(T6,fraction),LastValue(BarIndex())-(numbars/hts),LastValue (T6,1) , 2);
Plot(IIf( tn > endtime , b6, Null ),"",47, styleDashed+ styleNoLabel);
PlotText("2.50= " + WriteVal(B6,fraction),LastValue(BarIndex())-(numbars/hts),LastValue (B6,1) , 2);
}if(Cb7==1)**
Plot( T7,"", colorLightBlue, 1|styleNoLabel );
Plot( B7,"", colorLightBlue, 1|styleNoLabel );}
Plot(Close, "Price", 47, styleCandle );
up= tn > endtime AND((Cross(Close,t0)OR Cross(Close,t1)OR Cross(Close,t2) OR Cross(Close,t3)OR Cross(Close,t4)OR Cross(Close,t5)OR Cross(Close,t6) OR Cross(Close,t7)
OR Cross(Close,b0) OR Cross(Close,b1) OR Cross(Close,b2) OR Cross(Close,b3) OR Cross(Close,b4) OR Cross(Close,b5) OR Cross(Close,b6) OR Cross(Close,b7)));
dn=tn > endtime AND ((Cross(b0,Close)OR Cross( b1,Close)OR Cross( b2,Close)OR Cross(b3,Close)OR Cross( b4,Close)OR Cross( b5,Close) OR Cross( b6,Close) OR Cross( b7,Close)
OR Cross(t0,Close)OR Cross( t1,Close)OR Cross( t2,Close)OR Cross(t3,Close)OR Cross( t4,Close)OR Cross( t5,Close)OR Cross( t6,Close)OR Cross( t7,Close)));
Cb7=ParamToggle("Alerts","NO|YES" ,0);if(Cb7==1)**
PlotShapes( IIf( up, shapeUpArrow, shapeNone ),10,0,L,-20 );
PlotShapes( IIf( dn, shapeDownArrow, shapeNone ),13,0,H,-20 );}
//------------------------------------------------------------
HaC=(O+H+L+C)/4;
pab=tn > endtime AND (Cross(HaC,t0)OR Cross(Hac,b0));
pb= tn > endtime AND (Cross(HaC,t1) OR Cross(Hac,b1));
pb1=tn > endtime AND (Cross(HaC,t2) OR Cross(Hac,b2));
pb2=tn > endtime AND (Cross(HaC,t3) OR Cross(Hac,b3)) ;
pb3=tn > endtime AND (Cross(HaC,t4) OR Cross(Hac,b4));
pb4=tn > endtime AND (Cross(HaC,t5)OR Cross(Hac,b5));
pb5=tn > endtime AND (Cross(HaC,t6)OR Cross(Hac,b6));
pb6=tn > endtime AND (Cross(HaC,t7)OR Cross(Hac,b7));
pas=tn > endtime AND (Cross(b0,HaC)OR Cross(t0,HaC));
ps= tn > endtime AND (Cross( b1,HaC)OR Cross( t1,HaC));
ps1=tn > endtime AND (Cross( b2,HaC)OR Cross( t2,HaC));
ps2=tn > endtime AND (Cross(b3,HaC)OR Cross(t3,HaC));
ps3=tn > endtime AND (Cross( b4,HaC)OR Cross( t4,HaC));
ps4=tn > endtime AND (Cross( b5,HaC)OR Cross( t5,HaC));
ps5=tn > endtime AND (Cross( b6,HaC)OR Cross( t6,HaC));
ps6=tn > endtime AND (Cross( b7,HaC)OR Cross( t7,HaC));
PlotP = ParamToggle("Plot Shapes","Off,On",0);
//P1Shape = Param("buy Shape Typ",35,0,50,1);
//P2Shape = Param("sell Shape Typ",36,0,50,1);
if(PlotP)**
PlotShapes(IIf(pab,shapeDigit1,shapeNone),colorAqu a,0,L,-10 );
PlotShapes(IIf(pas,shapeDigit1,shapeNone),colorCus tom2,0,H,10 );
PlotShapes(IIf(pb,shapeDigit2,shapeNone),colorLime ,0,L,-10 );
PlotShapes(IIf(ps,shapeDigit2,shapeNone),colorOran ge,0,H,10 );
PlotShapes(IIf(pb1,shapeDigit3,shapeNone),2,0,L,-10 );
PlotShapes(IIf(ps1,shapeDigit3,shapeNone),13,0,H,1 0 );
PlotShapes(IIf(pb2,shapeDigit4,shapeNone),6,0,L,-10 );
PlotShapes(IIf(ps2,shapeDigit4,shapeNone),31,0,H,1 0 );
PlotShapes(IIf(pb3,shapeDigit5,shapeNone),5,0,L,-10 );
PlotShapes(IIf(ps3,shapeDigit5,shapeNone),4,0,H,10 );
PlotShapes(IIf(pb4,shapeDigit6,shapeNone),5,0,L,-10 );
PlotShapes(IIf(ps4,shapeDigit6,shapeNone),4,0,H,10 );
PlotShapes(IIf(pb5,shapeDigit7,shapeNone),5,0,L,-10 );
PlotShapes(IIf(ps5,shapeDigit7,shapeNone),4,0,H,10 );
PlotShapes(IIf(pb6,shapeDigit8,shapeNone),5,0,L,-10 );
PlotShapes(IIf(ps6,shapeDigit8,shapeNone),4,0,H,10 );
}
Title = EncodeColor(colorWhite)+ "Volatility-Bands stocks" + " - " + Name() + " - " + EncodeColor(colorRed)+ Interval(2) + EncodeColor(colorWhite) +
" - " + Date() +" - "+"\n" +EncodeColor(colorYellow) +"Op-"+O+" "+"Hi-"+H+" "+"Lo-"+L+" "+
"Cl-"+C+" "+ "Vol= "+ WriteVal(V);
_SECTION_END();
_SECTION_BEGIN("Background text");
C11=ParamColor("up panel",colorDarkOliveGreen );
C12=ParamColor("dn panel",colorDarkGrey );
C13=Param("fonts",20,10,30,1 );
C14=Param("left-right",2.1,1.0,5.0,0.1 );
C15=Param("up-down",12,1,20,1 );
Miny = Status("axisminy");
Maxy = Status("axismaxy");
lvb = Status("lastvisiblebar");
fvb = Status("firstvisiblebar");
pxwidth = Status("pxwidth");
pxheight = Status("pxheight");
GfxSetBkMode( 0 );
GfxSetOverlayMode(1);
GfxGradientRect(0,0,pxwidth, pxheight, C11, C12 );
GfxSelectFont("Tahoma", Status("pxheight")/C13 );
GfxSetTextAlign( 6 );
GfxTextOut( Name(), Status("pxwidth")/C14, Status("pxheight")/C15 );
GfxSelectFont("Tahoma", Status("pxheight")/C13*0.5 );
GfxTextOut( "Volatility Bands - stocks", Status("pxwidth")/C14, Status("pxheight")/C15*2.5 );
GfxSelectFont("Tahoma", Status("pxheight")/C13*0.5 );
GfxTextOut( " www.TAtechnics.in", Status("pxwidth")/C14, Status("pxheight")/C15*4 );
_SECTION_END();
NewDay = Day() != Ref( Day(), -1 );
DailyBarNum = BarsSince( NewDay ) + 1;
DBN = DailyBarNum <= 1;
Plot( DBN, "Day Seprator", 31, styleHistogram| styleOwnScale | styleNoLabel);
-
Những thành viên sau đã cám ơn :
tronghoangfi (04-10-2012)
-
11-09-2012 11:12 AM #8
- Ngày tham gia
- Oct 2009
- Bài viết
- 1,925
- Được cám ơn 617 lần trong 428 bài gởi
Phân tích kỹ thuật - AmiBroker Code
Đây là loạt bài về phần mềm phân tích kỹ thuật AmiBroker
Optimization Iteration Reload (OIR) for AmiBroker
One of the (few) notable hardships of using AmiBroker is the inability to view a single optimization iteration result in a backtest or on a chart without having to manually re-enter each of the (who knows how many ...) individual strategy parameters - once thru all of them to setup a backtest, then once thru all of them again to visualize on a chart, and then all of this all over again for every single optimization iteration you want to examine.
CodeForTraders is very pleased to offer our solution to this chore - Optimization Iteration Reload for AmiBroker.
What It Is
Optimization Iteration Reload for AmiBroker is an Excel VBA application, and a process for using it, that allows you to quickly browse optimization results and choose any iteration you wish for quick, "no typing required" reloading into the AA Window parameter set or your chart parameter set.
The only modification needed to your code is the addition of a #include line, which results in the loading of the product output.
How It Works
There are just a few steps involved:
Prep your strategy code by adding the #include line
After your optimization, do a File -> Export of the AA Window results to a .csv file
Open the .csv file in Excel, and highlight the parameters for your chosen iteration
Use Alt-F8 (or your own hotkey) to invoke Optimization Iteration Reload
Return to your chart and use the Parameter Dialog reset button, or
Return to the AA Window, use the Parameter Dialog reset button, and run a backtest
The whole process takes mere seconds.
What It Looks Like
Bim, Bam, Boom - you can now easily browse any iteration of any optimization, choosing it for generation of a complete backtest report with performance graphs - NO TYPING REQUIRED !
Take a look at how it's done:
http://www.screencast.com/t/ajppho5f
-
Có 2 thành viên đã cám ơn tigeran :
tradingpro8x (13-08-2013), tronghoangfi (04-10-2012)
-
11-09-2012 09:45 AM #9
- Ngày tham gia
- Oct 2009
- Bài viết
- 1,925
- Được cám ơn 617 lần trong 428 bài gởi
Phân tích kỹ thuật - AmiBroker
Có cái chỉ báo phân tích kỹ thuật AmiBroker khá hay nè các bác
Weekly Price Graph
weeklyopen = TimeFrameGetPrice("O",inWeekly);
weeklyhigh = TimeFrameGetPrice("H",inWeekly);
weeklylow = TimeFrameGetPrice("L",inWeekly);
weeklyclose = TimeFrameGetPrice("C",inWeekly);
weeklyOpen = TimeFrameCompress( weeklyOpen, inWeekly );weeklyHigh = TimeFrameCompress( weeklyHigh, inWeekly );weeklyLow = TimeFrameCompress( weeklyLow, inWeekly );weeklyClose = TimeFrameCompress( weeklyClose, inWeekly );
PlotOHLC(weeklyopen,weeklyhigh,weeklylow,weeklyclo se,"WEEK",colorBlack,styleCandle);
-
Có 2 thành viên đã cám ơn tigeran :
abasg2307 (30-11-2015), tronghoangfi (04-10-2012)
-
19-08-2013 03:00 PM #10
- Ngày tham gia
- Oct 2009
- Bài viết
- 1,925
- Được cám ơn 617 lần trong 428 bài gởi
Kinh nghiệm phân tích kỹ thuật PTKT và đầu tư trên thị trường chứng khoán
Là dân chuyên phân tích kỹ thuật PTKT thì cũng phải tự lập trình chứ bác, chứ chả nhẽ cứ lấy của người khác mãi coi sao được

-
Có 3 thành viên đã cám ơn tigeran :
1nightdream (16-09-2013), quannh (14-09-2013), tradingpro8x (23-08-2013)
-
06-03-2012 08:40 AM #11
- Ngày tham gia
- Oct 2003
- Bài viết
- 365
- Được cám ơn 215 lần trong 148 bài gởi
PTKT - Tuyệt Chiêu AmiBroker
THật ra mình thấy cũng không cần quá nhiều "tuyệt chiêu" làm gì. Cứ mấy cái Template của AmiBroker là xài mệt nghỉ rùi
-
Có 2 thành viên đã cám ơn 1nightdream :
abasg2307 (30-11-2015), tradingpro8x (13-08-2013)
-
13-08-2013 09:04 AM #12
- Ngày tham gia
- Oct 2003
- Bài viết
- 365
- Được cám ơn 215 lần trong 148 bài gởi
Kinh nghiệm phân tích kỹ thuật PTKT chứng khoán bằng AmiBroker
Kinh nghiệm phân tích kỹ thuật của mình thì nên xài Cách 3 cho khỏe
Cuộc đời tàn nhẫn nuôi anh lớn
Xã hội khốn nạn dạy anh khôn
-
Có 3 thành viên đã cám ơn 1nightdream :
quannh (14-09-2013), tigeran (19-08-2013), tradingpro8x (23-08-2013)
-
14-09-2013 11:28 PM #13
- Ngày tham gia
- Dec 2006
- Bài viết
- 38
- Được cám ơn 1 lần trong 1 bài gởi
Đúng là cách 3 là khỏe nhất Gửi bởi 1nightdream


-
11-04-2015 09:03 AM #14
- Ngày tham gia
- Apr 2015
- Bài viết
- 11
- Được cám ơn 1 lần trong 1 bài gởi
thì ra là code à
-
16-02-2012 08:23 AM #15
- Ngày tham gia
- Oct 2009
- Bài viết
- 1,925
- Được cám ơn 617 lần trong 428 bài gởi
Phân tích kỹ thuật - Chỉ báo AmiBroker
Mình thấy có cái công thức này nè bác, phân tích ra cũng gần gần như RMO Trade Mode bên MetaStock đấy
//////
_SECTION_BEGIN("RMO");
SwingTrd1 = 100 * (Close - ((MA(C,2)+
MA(MA(C,2),2)+
MA(MA(MA(C,2),2),2) +
MA(MA(MA(MA(C,2),2),2),2) +
MA(MA(MA(MA(MA(C,2),2),2),2),2) +
MA(MA(MA(MA(MA(MA(C,2),2),2),2),2),2) +
MA(MA(MA(MA(MA(MA(MA(C,2),2),2),2),2),2),2)+
MA(MA(MA(MA(MA(MA(MA(MA(C,2),2),2),2),2),2),2),2)+
MA(MA(MA(MA(MA(MA(MA(MA(MA(C,2),2),2),2),2),2),2), 2),2)+
MA(MA(MA(MA(MA(MA(MA(MA(MA(MA(C,2),2),2),2),2),2), 2),2),2),2))/10))/(HHV(C,10)-LLV(C,10));
SwingTrd2=EMA(SwingTrd1,30);
SwingTrd3=EMA(SwingTrd2,30);
RMO= EMA(SwingTrd1,81);
Buy=Cross(SwingTrd2,SwingTrd3);
Sell=Cross(SwingTrd3,SwingTrd2);
Bull_Trend=EMA(SwingTrd1,81)>0;
Bear_Trend=EMA(SwingTrd1,81)<0;
Ribbon_kol=IIf(Bull_Trend,colorGreen, IIf(Bear_Trend,colorRed, colorBlack));
Plot(4, "ribbon", Ribbon_kol, styleOwnScale|styleArea|styleNoLabel, -0.5,100);
Impulse_UP= EMA(SwingTrd1,30) > 0;
Impulse_Down= EMA(SwingTrd1,81) < 0;
bar_kol=IIf(impulse_UP, colorBlue, IIf(impulse_Down, colorRed,IIf(Bull_Trend, colorRed, colorBlue)));
Plot(Close,"Close",bar_kol,styleBar | styleThick );
shape = Buy * shapeUpArrow + Sell * shapeDownArrow;
PlotShapes( shape, IIf( Buy, colorBlue, colorRed ),0, IIf( Buy, Low, High ) );
_SECTION_END();
/////Last edited by tigeran; 31-03-2015 at 09:39 AM.
-
Những thành viên sau đã cám ơn :
tronghoangfi (02-10-2012)
-
13-08-2013 08:31 AM #16
- Ngày tham gia
- Aug 2010
- Bài viết
- 648
- Được cám ơn 325 lần trong 218 bài gởi
Kinh nghiệm phân tích kỹ thuật PTKT chứng khoán bằng AmiBroker
Lập trình trong AmiBroker:
Cách 1: Sử dụng công cụ Formula Editor:
Vào , chọn Formula Editor hoăc chọn nút có hình cái búa (xem hình bên cạnh)
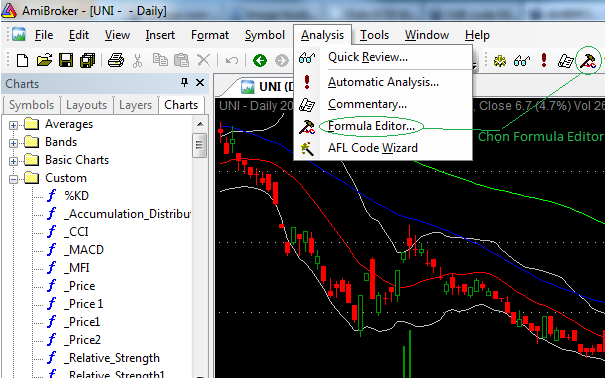
Cửa sổ Formula Editor sẽ mở ra:
Gõ nội dung code vào cửa sổ (hoặc copy từ nơi khác dán vào)
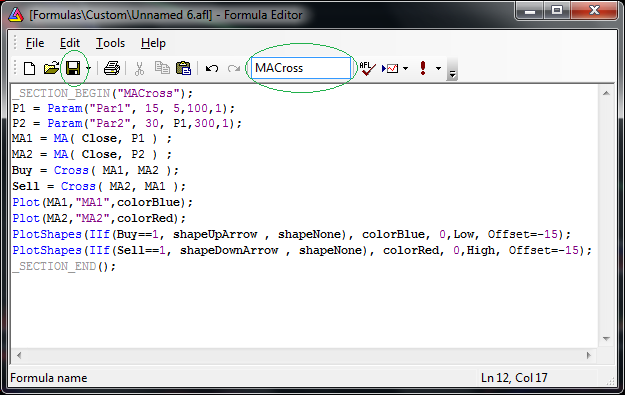
Gõ tên cho file code (để lưu lại) và chọn Save (từ menu File/Save hoặc nhấp vào nút Save. Sau đó, đóng cửa sổ Formula Editor .
Trong thí dụ trên tên file là MACross. Sẽ có 1 file tên MACross.afl được tạo ra trong folder Custom của Amibroker (thường mặc định là folder C:\Program Files\AmiBroker\Formulas\Custom).
Cách 2: Dùng NotePad tạo file .afl:
Cũng có thể dùng NotePad gõ nội dung code (hoặc copy từ nơi khác paste vào) cửa sổ NotePad.
Rồi lưu vào folder C:\Program Files\AmiBroker\Formulas\Custom với tên mở rộng là .afl (trong thí dụ trên là MACross.afl).
Lưu ý: Khi lưu nhớ chọn Save as type là All files
Cách 3: Sử dụng file .afl đã có sẵn:
Khi có sẵn files .afl (kể cả do người khác tạo ra). Để sử dụng files .afl, cần copy vào folder C:\Program Files\AmiBroker\Formulas\Custom.
Khi đó, trong Amibroker tên file afl đó sẽ xuất hiện trong mục Custom (trong tab Chart) và có thể sử dụng như các files khác đã có sẵn trong Ami.
-
Có 3 thành viên đã cám ơn tradingpro8x :
1nightdream (13-08-2013), meohoahoa (13-08-2013), tigeran (19-08-2013)
-
15-02-2012 08:22 AM #17
- Ngày tham gia
- Aug 2010
- Bài viết
- 648
- Được cám ơn 325 lần trong 218 bài gởi
Phân tích kỹ thuật - Chỉ báo AmiBroker
Có cao nhân nào biết công thức của hệ thống giao dịch phân tích kỹ thuật RMO Trade Mode trên AmiBroker không chỉ giúp em với
-
01-07-2013 02:46 PM #18
- Ngày tham gia
- Aug 2010
- Bài viết
- 648
- Được cám ơn 325 lần trong 218 bài gởi
Kinh nghiệm phân tích kỹ thuật PTKT và đầu tư trên thị trường chứng khoán
Trong mấy cái điều kiện của IS có có điều kiện CB cũng như chu kỳ nên chẳng thể coding được hết đâu
Với lại nếu cứ cứng nhắc theo cái điều kiện của IS thì cuối cùng sẽ chẳng có CP nào được chọn cả bạn uiLast edited by lientcv; 01-07-2013 at 03:14 PM.
-
Những thành viên sau đã cám ơn :
tigeran (19-08-2013)
-
11-02-2012 09:50 AM #19
- Ngày tham gia
- Oct 2009
- Bài viết
- 1,925
- Được cám ơn 617 lần trong 428 bài gởi
Phân tích kỹ thuật - Chỉ báo AmiBroker
Cái này nhìn có vẻ giống một bộ lọc trong AmiBroker. Bác kiếm được ở đâu thế
-
01-07-2013 10:59 AM #20
- Ngày tham gia
- May 2013
- Bài viết
- 15
- Được cám ơn 8 lần trong 6 bài gởi
có bác nào bít code của IS này ko. cho em xin với
em mới đọc lại bài này có cái IS này mà ko bít code: anh em nào có up lên đc ko. em cảm ơn
Indicators System (IS):
1. Người sử dụng IS phải chắc chắn rằng mã cổ phiếu được lựa chọn là một cổ phiếu có các chỉ số FA tốt (P/E, ROA, ROE, P/BV v.v…)
2. Người sử dụng IS phải chắc chắn rằng mã cổ phiếu được lựa chọn vừa trải qua 3 thời kỳ : Tăng trưởng – Phân phối – Suy giảm và đang ở trong thời kỳ Tích lũy
3. Sau một thời gian ngừng giao dịch đủ dài, thị trường luôn luôn có một sự thay đổi theo chiều hướng tích cực. Đặc thù của thị trường Việt Nam là có 04 kỳ nghỉ dài : Tết Dương lịch, Tết Âm lịch, Ngày Quốc tế Lao động, Ngày Quốc khánh.
4. Người sử dụng IS phải chắc chắn rằng chênh lệch tính bằng % giữa thị giá tại đỉnh tăng trưởng so với thị giá trung bình của thời kỳ tích lũy phải luôn lớn hơn lợi nhuận kỳ vọng của người sử dụng.
5. Người sử dụng IS phải chắc chắn rằng MACD luôn luôn có phân kỳ dương tối thiểu > 10 phiên giao dịch
6. Người sử dụng IS phải chắc chắn rằng độ rộng của Bollinger Bands đang được thu lại rất hẹp và ổn định > 10 phiên giao dịch
7. Người sử dụng IS phải chắc chắn rằng chỉ thực hiện hành động mua sau khi xuất hiện ngôi sao Doji.
8. Người sử dụng IS phải chắc chắn rằng trong vòng 10 phiên giao dịch gần nhất, mã cổ phiếu được chọn không hề chịu tác động của bất kỳ tin tức có tác động trước hoặc tức thời vào giá mang tính chất thuận lợi hoặc bất lợi
9. Người sử dụng IS phải chắc chắn rằng tính từ thời điểm quyết định mua đến thời điểm mua được, 08 điều kiện trên không hề thay đổi.
10. Người sử dụng IS phải chắc chắn rằng chỉ thực hiện hành động mua khi cả 09 điều kiện trên cùng xuất hiện.
-
Có 3 thành viên đã cám ơn phan91 :
1nightdream (13-08-2013), Hidenseek (13-08-2013), quannh (14-09-2013)


 Trích dẫn
Thông tin của chủ đề
Users Browsing this Thread
Có 1 thành viên đang xem chủ đề này. (0 thành viên và 1 khách vãng lai)
Similar Threads
-
Tuyệt chiêu trong MetaStock
By tigeran in forum Phân tích kỹ thuật MetaStockTrả lời: 12Bài viết cuối: 03-03-2011, 08:53 AM -
Tóm tắt buổi tọa đàm chiều 14.11 tại 59C Nguyễn Đình Chiểu
By luxubu50 in forum Nhận định Thị trườngTrả lời: 0Bài viết cuối: 15-11-2009, 10:30 AM
 Quyền viết bài
- Bạn Không thể gửi Chủ đề mới
- Bạn Không thể Gửi trả lời
- Bạn Không thể Gửi file đính kèm
- Bạn Không thể Sửa bài viết của mình

Bookmarks