


Chủ đề: VNI và CP dưới góc nhìn PTKT
-
02-10-2009 02:18 PM #5001
- Ngày tham gia
- Sep 2006
- Bài viết
- 1,025
- Được cám ơn 23 lần trong 16 bài gởi

Cũng hy vọng như bác Pi nói lắm để hoàn thiện cái mô hình đầu vai nhỉ, nhưng gói kích cầu 2 chưa thấy đâu, nợ chính phủ tăng cao
DJ cũng có khả năng lớn là tạo Rounding Top, và nếu Vnindex có rơi thêm thì không phải do tăng trưởng kinh tế không tốt mà là do ảnh hưởng của DJ
Em nghĩ mua lại ở cuối con sóng 2 cũng tốt chứ?
-
02-10-2009 02:18 PM #5002
- Ngày tham gia
- Aug 2007
- Bài viết
- 93
- Được cám ơn 0 lần trong 0 bài gởi
Xịt tóc này là hàng dzom hàng nhái. Gửi bởi gà mái tơ

Cụ xịt tóc rồ thiệt vô xác nhận cái.
-
02-10-2009 02:25 PM #5003
- Ngày tham gia
- Oct 2008
- Bài viết
- 1,998
- Được cám ơn 36 lần trong 29 bài gởi
Đón lõng ngay mốc 450-480 là vừa ! Lần này các CTCK sẽ góp phần làm cho thị trường giảm mạnh. Họ đã cho nhà đầu tư sử dụng đòn bẩy tài chính quá nhiều. Và khi thị trường giảm thì tiền ảo được đem bán tống bán tháo. Chỉ thiệt cho nhà đầu tư nhỏ chen lệnh ko lại. Gửi bởi hoadoquyen
-
02-10-2009 02:41 PM #5004

- Ngày tham gia
- Nov 2008
- Bài viết
- 2,437
- Được cám ơn 75 lần trong 37 bài gởi
Cái hoa loa kèn về 410 nào hú hú hú.. Gửi bởi hoadoquyen

-
02-10-2009 02:44 PM #5005
- Ngày tham gia
- Mar 2008
- Bài viết
- 4,409
- Được cám ơn 64 lần trong 49 bài gởi
Đẹp giề, em tạm biệt nó mấy bữa nay, hôm nay nhìn nó thấy tội cho cụ nào lỡ ôm mà thoai! Gửi bởi stockprovn
Về 27.X em sẽ ôm lại giúp cho!
-
02-10-2009 02:44 PM #5006
- Ngày tham gia
- May 2009
- Bài viết
- 1,102
- Được cám ơn 0 lần trong 0 bài gởi
Giọng Stockprovn không giống giọng Stockpro chính hãng bên Tình hình hiện nay, bên THHN cụ stoc đang dự đoán là "Lượng đặt mua của phiên giao dịch thoả thuận đã cho thấy sức cầu vẫn tiềm ẩn khả năng hình thành cơn bão tăng giá trong những phiên giao dịch tuần đầu tiên trong tháng 10 này.
Chúc các bạn có một kỳ nghỉ vui vẻ và thoải mái! ,"Last edited by Pi; 02-10-2009 at 02:47 PM.
-
02-10-2009 02:53 PM #5007
- Ngày tham gia
- Oct 2008
- Bài viết
- 1,998
- Được cám ơn 36 lần trong 29 bài gởi
Những lúc mà Hưng nùn xuất hiện thì nên cảnh giác ! Gửi bởi Pi
-
02-10-2009 02:56 PM #5008
- Ngày tham gia
- Sep 2006
- Bài viết
- 1,025
- Được cám ơn 23 lần trong 16 bài gởi
Bác Stockpro phân tích liên tục như vậy nhà đầu tư không kien định đọc rất mất phương hướng,
-
02-10-2009 03:03 PM #5009

- Ngày tham gia
- Sep 2006
- Bài viết
- 1,441
- Được cám ơn 9 lần trong 2 bài gởi
-
02-10-2009 03:04 PM #5010
- Ngày tham gia
- Jan 2006
- Bài viết
- 771
- Được cám ơn 0 lần trong 0 bài gởi
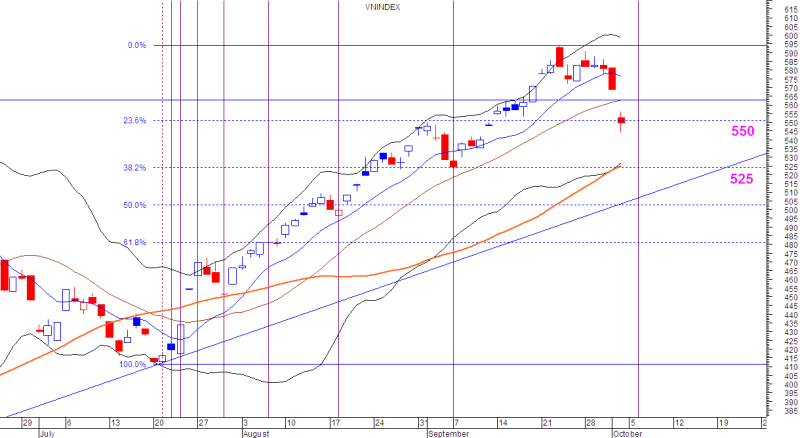
VN-Index đã có một tuần mất điểm với 1 phiên “rơi tự do” vào cuối tuần. Hiện tại, các chỉ báo kỹ thuật đều cho tín hiệu xấu ngoại trừ khối lượng giao dịch vẫn duy trì ở mức cao.
- MACD đã cắt xuống phía dưới đường signal.
- DI+ đã cắt xuống phía dưới DI-.
- RSI giảm sâu dưới ngưỡng 50.
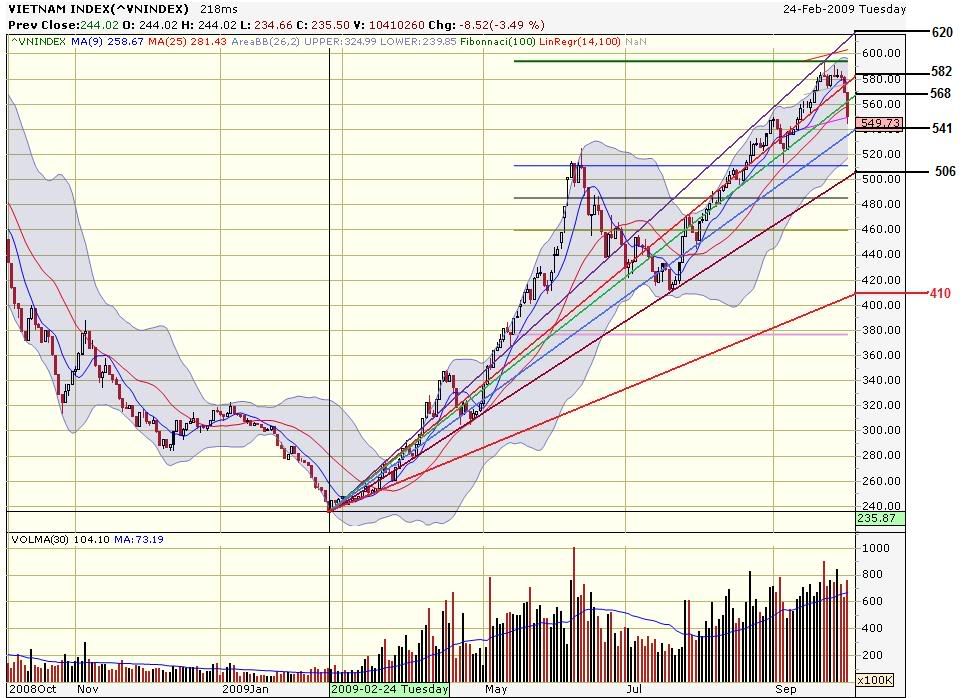
Ngưỡng hỗ trợ 550 điểm (tương ứng Fib23.6% của sóng tăng từ 411 lên 594) đã bị phá vỡ. Ngưỡng hỗ trợ tiếp theo là 525 điểm (tương ứng với Fib38.2%) hiện đang trùng với đường MA50. Mặt khác, nếu sử dụng Fibonacci time zone lấy gốc thời gian là ngày 21/7 thì ngày 6/10 sẽ có ý nghĩa như kết thúc một cycle (sóng). Lịch sử đã cho thấy, ngày 30/7, 18/8, 7/9 (tương ứng các mốc trên Fibonacci time zone) là những ngày cuối của sóng điều chỉnh.
Kết hợp phân tích Fibonacci Retracement và Fibonacci time zone, chúng tôi cho rằng 525 điểm là ngưỡng hỗ trợ mạnh của VN-Index.
-
02-10-2009 03:09 PM #5011
- Ngày tham gia
- May 2009
- Bài viết
- 1,102
- Được cám ơn 0 lần trong 0 bài gởi
Cái này thì có vẻ chính xác, sẽ có đột biến gien ngay sau đó, đợt trước hô sẽ giảm là giảm thật, đợt này khó giảm sâu thì lại giảm sâu, đại để tướng cụ Nùn Lé hợp với thị trường xấu đi, cụ ấy bây giờ như INDICATOR của sóng lớn cho BBs, ám hiệu.. đỡ phải thông tin liên lạc cho mệt Gửi bởi stockprovn
Last edited by Pi; 02-10-2009 at 03:12 PM.
-
02-10-2009 03:21 PM #5012
- Ngày tham gia
- Aug 2009
- Bài viết
- 428
- Được cám ơn 5 lần trong 5 bài gởi
Hôm qua cụ cắt trỷm CII hả? Gửi bởi lang bam
Vậy hôm nay em lang thang tại CII nhặt được mấu tre, chắc là của cụ roài.
Em thả mồi có 57.5 mà lại vớ được khúc trỷm của cụ.
Cuối phiên nó hồi về tham chiếu đã dài được thêm 5 phân roài.
Em về cắm tạm vào con búp bê nhựa nhà em để nuôi dưỡng.
Lúc nào nó dài cụ đến em cho xin lại....... hê hế.............Last edited by phatloc168; 02-10-2009 at 03:46 PM.
-
02-10-2009 03:44 PM #5013
- Ngày tham gia
- Jun 2007
- Bài viết
- 9,003
- Được cám ơn 159 lần trong 83 bài gởi
??????????????????????????????????????????????? Gửi bởi stockprovn
????????????????????????????????????????????????
????????????????????????????????????????????????
Tuần sau khối người than khóc mất hàng.
- ***____Chứng khoán mỗi ngày một thế cờ ____****
-
02-10-2009 03:55 PM #5014
- Ngày tham gia
- Nov 2008
- Bài viết
- 2,437
- Được cám ơn 75 lần trong 37 bài gởi
Chạy giề, DM vẫn như cũ, chỉ có giá vốn giảm xuống thoai he he he Gửi bởi lang bam
Sẵn tiền sẵn cổ, cụ nào chạy là em nện cho nhừ xương, cụ nào ham hố quá nhào vô, em đá nhừ tử cóc ọc ọc ọc...
-
03-10-2009 10:25 AM #5015
- Ngày tham gia
- Sep 2006
- Bài viết
- 1,025
- Được cám ơn 23 lần trong 16 bài gởi
Với bài phân tích của bác Bonjovi mình đưa thêm cái chạt của DJ để tham khảo.
Mình thây Khả năng DJ tạo nên mô hình vòng lượn đỉnh là rất lớn, đường hỗ trợ màu xanh nếu tại dây DJ bật lên sẽ tạo nên 1 HnS nhỏ? rủi ro rơi qua đường màu nâu DJ sẽ chấm dứt chuỗi uptrend dài hạn.
Cũng khá tương đồng với điểm hỗ trợ mà bác Bon lựa chọn cho VNindex chăng?

-
03-10-2009 12:35 PM #5016
- Ngày tham gia
- Nov 2008
- Bài viết
- 2,437
- Được cám ơn 75 lần trong 37 bài gởi
-
03-10-2009 02:44 PM #5017
- Ngày tham gia
- Oct 2008
- Bài viết
- 1,998
- Được cám ơn 36 lần trong 29 bài gởi
Bác đưa ra cái mốc 410 nhìn mà ghê quá ! Tới 450-480 là cả khối người nhào lộn rồi !
-
03-10-2009 09:53 PM #5018
- Ngày tham gia
- May 2009
- Bài viết
- 1,102
- Được cám ơn 0 lần trong 0 bài gởi
quyen à, thằng Mẽo bây giờ không khác VN mình mấy ở cái khoản nắn và hô hào, vấn đề là tâm lý, đảm bảo quyen là anh ÔmBaBa thế nào cũng có chiêu cơ họ để Dj quanh quẩn 9000-gần 10.000d, còn SP500 trên 1000d,
-
04-10-2009 05:44 PM #5019
- Ngày tham gia
- Sep 2009
- Bài viết
- 608
- Được cám ơn 24 lần trong 17 bài gởi
Bump and Run Reversal (Reversal)
As the name implies, the Bump and Run Reversal (BARR) is a reversal pattern that forms after excessive speculation drives prices up too far, too fast. Developed by Thomas Bulkowski, the pattern was introduced in the June-97 issue of Technical Analysis of Stocks and Commodities and also included in his recently published book, the Encyclopedia of Chart Patterns.
The pattern was originally named the Bump and Run Formation, or BARF. Bulkowski decided that Wall Street was not ready for such an acronym and changed the name to Bump and Run Reversal. Bulkowski identified three main phases to the pattern: lead-in, bump and run. We will examine these phases and also look at volume and pattern validation.

- Lead-in Phase: The first part of the pattern is a lead-in phase that can last 1 month or longer and forms the basis from which to draw the trend line. During this phase, prices advance in an orderly manner, and there is no excess speculation. The trend line should be moderately steep. If it is too steep, then the ensuing bump is unlikely to be significant enough. If the trend line is not steep enough, then the subsequent trend line break will occur too late. Bulkowski advises that an angle of 30 to 45 degrees is preferable. The size of the angle will depend on the scaling (semi-log or arithmetic) and the size of the chart. It is probably easier to judge the soundness of the trend line with a visual assessment.
- Bump Phase: The bump forms with a sharp advance, and prices move further away from the lead-in trend line. Ideally, the angle of the trend line from the bump's advance should be about 50% greater than the angle of the trend line extending up from the lead-in phase. Roughly speaking, this would call for an angle between 45 and 60 degrees. If it is not possible to measure the angles, then a visual assessment will suffice.
- Bump Validity: It is important that the bump represent a speculative advance that cannot be sustained for a long time. Bulkowski developed what he calls an "arbitrary" measuring technique to validate the level of speculation in the bump. The distance from the highest high of the bump to the lead-in trend line should be at least twice the distance from the highest high in the lead-in phase to the lead-in trend line. These distances can be measured by drawing a vertical line from the highest highs to the lead-in trend line. An example is provided below.
- Bump Rollover: After speculation dies down, prices begin to peak and a top forms. Sometimes, a small double top or a series of descending peaks forms. Prices begin to decline towards the lead-in trend line, and the right side of the bump forms.
- Volume: As the stock advances during the lead-in phase, volume is usually average and sometimes low. When the speculative advance begins to form the left side of the bump, volume expands as the advance accelerates.
- Run Phase: The run phase begins when the pattern breaks support from the lead-in trend line. Prices will sometimes hesitate or bounce off the trend line before breaking through. Once the break occurs, the run phase takes over, and the decline continues.
- Support Turns Resistance: After the trend line is broken, there is sometimes a retracement that tests the newfound resistance level. Potential support-turned-resistance levels can also be identified from the reaction lows within the bump.

Level Three Communications (LVLT) formed a Bump and Run Reversal pattern after prices advanced in a speculative frenzy at the beginning of 2000. Prices advanced from 72 to 132 in 2 months and this advance ultimately proved unsustainable.- The lead-in phase formed over a 3 month period from early Oct-99 to early Jan-00. Volume during this phase was relatively subdued, and actually declined during the November and December advance.
- The trend line extending up from the lead-in phase lows formed a 34 degree angle. A visual assessment also reveals that this trend line is neither too steep nor too flat.
- The bump phase began in early January when the advance accelerated with a large increase in volume. A conservatively drawn trend line formed a 51 degree angle that was exactly 50% larger than the angle from the lead-in trend line.
- The distance from the lead-in phase's highest high to the trend line. was 13. The distance from the Bump Phase's highest high to the trend line was 38. This is almost three times larger, and validates the speculative excesses in the bump.
- After reaching a high around 132, prices declined sharply, and bounced off the lead-in trend line. A lower high formed around 115 (red arrow), and the trend line was soon broken.
- The decline continued after the trend line break, and reached 67 before a reaction rally began. The reaction rally advanced to around 95, but fell just short of the horizontal support line before falling back to new lows.
Last edited by nguoibuontin; 04-10-2009 at 05:49 PM.
-
04-10-2009 10:57 PM #5020
- Ngày tham gia
- Jul 2008
- Bài viết
- 328
- Được cám ơn 0 lần trong 0 bài gởi
Indicator hoadoquyen vẫn không ngừng nhận định TT down àh?
Vậy là pà kon trên tàu yên tơm nhé!!! . Khi nào hoadoquyen mua vào thì cũng nhớ phát tín hiệu với nha!!! . Đùa tí!!


 chạy sàn

Thông tin của chủ đề
Users Browsing this Thread
Có 1 thành viên đang xem chủ đề này. (0 thành viên và 1 khách vãng lai)
Similar Threads
-
PVA- dầu khí Quê choa đã dưới giá sổ sách
By JackSparow in forum Công ty chiến ở HNXTrả lời: 15Bài viết cuối: 01-01-2009, 03:39 PM -
CP dưới mệnh giá ? HOSE
By leduyenha in forum Doanh nghiệp sàn HoSETrả lời: 3Bài viết cuối: 03-12-2008, 02:14 PM -
CP dưới mệnh giá ? - HASTC
By leduyenha in forum Công ty chiến ở HNXTrả lời: 1Bài viết cuối: 27-11-2008, 11:58 AM -
bán phá giá Nam Á , ai có Nam Á giá dưới 9.x gọi ngay nhé, mua hết
By naturalkiller in forum SÀN OTC CỔ PHIẾUTrả lời: 0Bài viết cuối: 14-03-2007, 05:45 PM
 Quyền viết bài
- Bạn Không thể gửi Chủ đề mới
- Bạn Không thể Gửi trả lời
- Bạn Không thể Gửi file đính kèm
- Bạn Không thể Sửa bài viết của mình

Bookmarks