


Hybrid View
-
28-04-2017 06:28 PM #1
- Ngày tham gia
- Mar 2016
- Đang ở
- https://nguyenphuochai.vn/
- Bài viết
- 2,011
- Được cám ơn 3 lần trong 3 bài gởi
 Website : https://nguyenphuochai.vn//
Mở TK HotForex: https://www.hotforex.com/?refid=116627
Mở TK Axitrader: https://goo.gl/iTGLce
Mobile : 0908950768 - Zalo - Viber
Không chia sẽ là hủy diệt- Sơn SVT
Tâm trạng không tốt-không trade ; thể trạng không khỏe -không trade
-
04-05-2017 02:26 PM #2
- Ngày tham gia
- Mar 2016
- Đang ở
- https://nguyenphuochai.vn/
- Bài viết
- 2,011
- Được cám ơn 3 lần trong 3 bài gởi
EUR/USD trong ngày: tỷ giá chinh chặn trần là 1,0910.

Điểm xoay: 1,0910
Khuyến nghị giao dịch: bán ở dưới 1,0910 với mục tiêu 1,0880 & 1,0860.
Phương án phụ: nếu vượt qua 1,0910, có thể tới 1,0925 & 1,0940.
Tư vấn kĩ thuật: tỷ giá có thể tăng nhưng cường độ sẽ bị giới hạn.
GBP/USD trong ngày: dưới áp lực.

Điểm xoay: 1,2900
Khuyến nghị giao dịch: bán ở dưới 1,2900 với mục tiêu 1,2860 & 1,2840.
Phương án phụ: nếu vượt qua 1,2900, có thể tới 1,2930 & 1,2950.
Tư vấn kĩ thuật: chỉ số RSI có xu thế giảm nhưng không rõ ràng.
USD/JPY trong ngày: xu hướng gia tăng tỷ giá tiếp tục được giữ.

Điểm xoay: 112,25
Khuyến nghị giao dịch: mua ở trên 112,25 với mục tiêu 112,90 & 113,15.
Phương án phụ: nếu thủng qua 112,25, có thể tới 111,95 & 111,75.
Tư vấn kĩ thuật: chỉ số RSI ở trên vùng trung tính 50%.
AUD/USD trong ngày: dưới áp lực.

Điểm xoay: 0,7455
Khuyến nghị giao dịch: bán ở dưới 0,7455 với mục tiêu 0,7385 & 0,7360.
Phương án phụ: nếu vượt qua 0,7455, có thể tới 0,7480 & 0,7500.
Tư vấn kĩ thuật: khi đường kháng cự 0,7455 không bị vượt qua, xu hướng giảm sẽ nhẹ.
Gold spot trong ngày: dưới áp lực.

Điểm xoay: 1245,00
Khuyến nghị giao dịch: bán ở dưới 1245,00 với mục tiêu 1234,00 & 1230,00.
Phương án phụ: nếu vượt qua 1245,00, có thể tới 1250,00 & 1254,00.
Tư vấn kĩ thuật: chỉ số RSI có xu thế giảm nhưng không rõ ràng.
Crude Oil (WTI) (M7) trong ngày: tỷ giá chinh chặn trần là 48,20.

Điểm xoay: 48,20
Khuyến nghị giao dịch: bán ở dưới 48,20 với mục tiêu 47,30 & 46,95.
Phương án phụ: nếu vượt qua 48,20, có thể tới 48,55 & 48,90.
Tư vấn kĩ thuật: tỷ giá có thể tăng nhưng cường độ sẽ bị giới hạn.Website : https://nguyenphuochai.vn//
Mở TK HotForex: https://www.hotforex.com/?refid=116627
Mở TK Axitrader: https://goo.gl/iTGLce
Mobile : 0908950768 - Zalo - Viber
Không chia sẽ là hủy diệt- Sơn SVT
Tâm trạng không tốt-không trade ; thể trạng không khỏe -không trade
-
08-05-2017 06:38 PM #3
- Ngày tham gia
- Mar 2016
- Đang ở
- https://nguyenphuochai.vn/
- Bài viết
- 2,011
- Được cám ơn 3 lần trong 3 bài gởi
EUR/USD trong ngày: quay trở xuống.

Điểm xoay: 1,1000
Khuyến nghị giao dịch: bán ở dưới 1,1000 với mục tiêu 1,0920 & 1,0900.
Phương án phụ: nếu vượt qua 1,1000, có thể tới 1,1020 & 1,1050.
Tư vấn kĩ thuật: chỉ số RSI di chuyển bất lợi.
GBP/USD trong ngày: xu hướng gia tăng tỷ giá bắt đầu từ 1,2940.

Điểm xoay: 1,2940
Khuyến nghị giao dịch: mua ở trên 1,2940 với mục tiêu 1,2990 & 1,3020.
Phương án phụ: nếu thủng qua 1,2940, có thể tới 1,2925 & 1,2900.
Tư vấn kĩ thuật: một vùng hỗ trợ tại 1,2940 được hình thành, cho phép sự ổn định tạm thời.
USD/JPY trong ngày: xu hướng gia tăng tỷ giá tiếp tục được giữ.

Điểm xoay: 112,45
Khuyến nghị giao dịch: mua ở trên 112,45 với mục tiêu 112,85 & 113,05.
Phương án phụ: nếu thủng qua 112,45, có thể tới 112,10 & 111,90.
Tư vấn kĩ thuật: chỉ số RSI mất động lực đi xuống.
AUD/USD trong ngày: dưới áp lực.

Điểm xoay: 0,7425
Khuyến nghị giao dịch: bán ở dưới 0,7425 với mục tiêu 0,7380 & 0,7360.
Phương án phụ: nếu vượt qua 0,7425, có thể tới 0,7445 & 0,7465.
Tư vấn kĩ thuật: chỉ số RSI mất động lực tăng.
Gold spot trong ngày: mức tăng dự đoán.

Điểm xoay: 1221,00
Khuyến nghị giao dịch: mua ở trên 1221,00 với mục tiêu 1236,00 & 1241,50.
Phương án phụ: nếu thủng qua 1221,00, có thể tới 1216,00 & 1210,00.
Tư vấn kĩ thuật: chỉ số RSI được hỗ trợ bởi đường xu thế hướng lên.
Crude Oil (WTI) (M7) trong ngày: xu hướng gia tăng tỷ giá tiếp tục được giữ.

Điểm xoay: 45,90
Khuyến nghị giao dịch: mua ở trên 45,90 với mục tiêu 47,00 & 47,30.
Phương án phụ: nếu thủng qua 45,90, có thể tới 45,30 & 44,85.
Tư vấn kĩ thuật: một vùng hỗ trợ tại 45,90 được hình thành, cho phép sự ổn định tạm thời.Website : https://nguyenphuochai.vn//
Mở TK HotForex: https://www.hotforex.com/?refid=116627
Mở TK Axitrader: https://goo.gl/iTGLce
Mobile : 0908950768 - Zalo - Viber
Không chia sẽ là hủy diệt- Sơn SVT
Tâm trạng không tốt-không trade ; thể trạng không khỏe -không trade
-
15-05-2017 08:47 AM #4
- Ngày tham gia
- Mar 2016
- Đang ở
- https://nguyenphuochai.vn/
- Bài viết
- 2,011
- Được cám ơn 3 lần trong 3 bài gởi
I’ve got a break-and-retest scenario and a long-term wedge bounce goin’ on in today’s canvas. Take a look at these potential long setups on USD/JPY and AUD/CAD!
USD/JPY: 4-hour
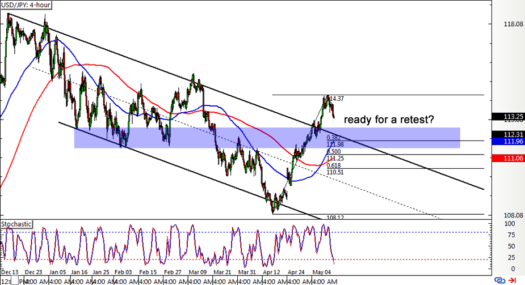
Earlier this month, USD/JPY broke past its descending channel resistance to show that it’s tired from the dive and that it’s ready for a reversal. Price seems to be due for a pullback from here so I whipped out the Fib tool to spot nearby correction levels.
The 38.2% Fibonacci retracement level is right smack in line with the 112.00 major psychological mark, which means that it could hold as a really strong floor. Not only that, but it also coincides with the broken channel resistance that might hold as support moving forward. Also, it lines up with the 100 SMA dynamic support.
This short-term moving average just crossed above the longer-term 200 SMA to confirm that buyers are taking the upper hand. Stochastic is still heading south in the meantime but is approaching the oversold region to indicate that sellers might want to take a break soon.
AUD/CAD: Daily
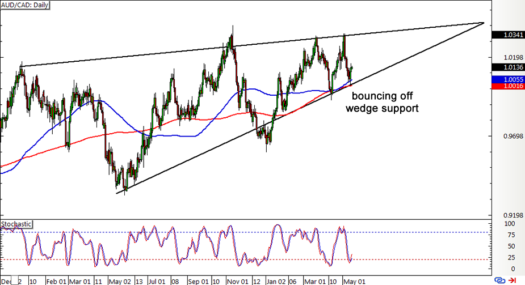
Remember that AUD/CAD rising wedge setup I showed y’all last week? Price is now testing support as expected and seems to be going for a bounce back to the resistance.
The 100 SMA is also holding as dynamic support since it lines up with the bottom of the wedge around the 1.0050 minor psychological mark and is also treading above the 200 SMA. At the same time, stochastic is pulling up from the oversold territory to suggest that bulls are about to charge.
This might be enough to take the pair up to the wedge resistance around the 1.0350-1.0400 levels or higher. Stronger buying momentum could even trigger an upside breakout and push AUD/CAD up by an additional 800 pips or the same height as the chart formation. Similarly, a break below the wedge support could take the pair down by 800 pips as well.
Forex Chart Settings:
Slow Stochastic: 14,3,3
100 SMA: Blue line
200 SMA: Red lineWebsite : https://nguyenphuochai.vn//
Mở TK HotForex: https://www.hotforex.com/?refid=116627
Mở TK Axitrader: https://goo.gl/iTGLce
Mobile : 0908950768 - Zalo - Viber
Không chia sẽ là hủy diệt- Sơn SVT
Tâm trạng không tốt-không trade ; thể trạng không khỏe -không trade
-
18-05-2017 05:57 PM #5
- Ngày tham gia
- Mar 2016
- Đang ở
- https://nguyenphuochai.vn/
- Bài viết
- 2,011
- Được cám ơn 3 lần trong 3 bài gởi
Điều này sẽ nói đầu tiên nhưng để thay đổi quả là rất khó. Hy vọng với những gì diễn ra ngày mai các anh chị sẽ thấy được gồng lỗ nó nguy hiểm cở nào nhưng vì nó không đáng sợ nên đa số sẽ tiếp tục gồng lỗ. Còn việc gồng lời nó khó chịu cở nào nhưng vì nó gây bất an nên đa số vẫn tiếp tục chốt non.
Đã có được 20 anh chị tham gia và tiếp tục tăng . Rất mong anh chị đã đăng ký tham gia đầy đủ .Website : https://nguyenphuochai.vn//
Mở TK HotForex: https://www.hotforex.com/?refid=116627
Mở TK Axitrader: https://goo.gl/iTGLce
Mobile : 0908950768 - Zalo - Viber
Không chia sẽ là hủy diệt- Sơn SVT
Tâm trạng không tốt-không trade ; thể trạng không khỏe -không trade
-
24-05-2017 11:18 AM #6
- Ngày tham gia
- Mar 2016
- Đang ở
- https://nguyenphuochai.vn/
- Bài viết
- 2,011
- Được cám ơn 3 lần trong 3 bài gởi
I’m serving up a Loonie special today, forex folks! This time we’re looking at a short-term trend on USD/CAD and a possible long-term triangle on AUD/CAD. Check ’em while they’re hot!
USD/CAD: 1-hour
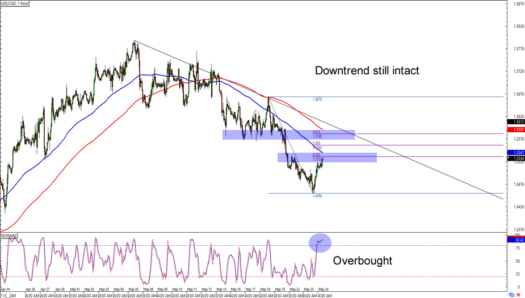
USD/CAD has found support from the 1.3450 area, and is now heading fast towards the falling trend line resistance that hasn’t been broken since the start of the month.
Stochastic is already in the overbought area, so dollar bears could strike at current levels, which is right around an area of interest from late last week as well as the 100 SMA and the 36.2% Fibonacci retracement level.
Or they could wait a bit more until the pair hits the 1.3600 psychological handle, which lines up with the 200 SMA, 61.8% Fibonacci retracement, AND the falling trend line on the 1-hour time frame. In any case, make sure you stick around to see if and when this baby starts to go back to its downtrend!
AUD/CAD: Daily
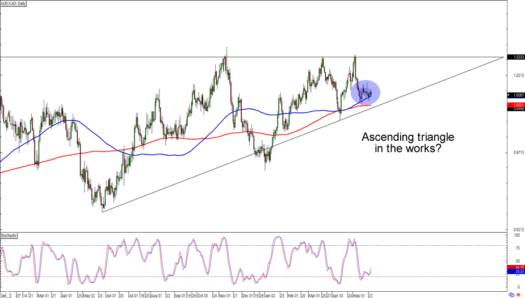
I spy with my cool, blue eyes an ascending triangle in the making! AUD/CAD is having trouble breaking below its current levels, which isn’t surprising since it’s near the 100 and 200 SMA as well as a rising trend line support that’s been holding since last year.
Think the Aussie will climb back up to retest its long-term resistance near 1.0330? A long trade at current levels could get you a pretty decent reward-to-risk ratio especially if you place your stops just below the trend line.
Be careful about trading currency crosses like this one, though, as they tend to see volatility like nobody’s business!
Forex Chart Settings:
Slow Stochastic: 14,3,3
100 SMA: Blue line
200 SMA: Red lineWebsite : https://nguyenphuochai.vn//
Mở TK HotForex: https://www.hotforex.com/?refid=116627
Mở TK Axitrader: https://goo.gl/iTGLce
Mobile : 0908950768 - Zalo - Viber
Không chia sẽ là hủy diệt- Sơn SVT
Tâm trạng không tốt-không trade ; thể trạng không khỏe -không trade
-
29-05-2017 08:15 AM #7
- Ngày tham gia
- Mar 2016
- Đang ở
- https://nguyenphuochai.vn/
- Bài viết
- 2,011
- Được cám ơn 3 lần trong 3 bài gởi
Weekly Trade Ideas & Technical Chart Analysis by Nial Fuller – May 29th to June 2nd 2017
EURUSD – Euro/dollar consolidates after surge higher, looking for pull back to buy

The EURUSD consolidated last week after it’s strong run higher in previous weeks. The trend is still up and we are still looking for a deeper pull back to get long, in-line with the uptrend. We are watching for buying opportunities down near 1.1075 to 1.1020 near-term support this week and we remain bullish whilst prices are above 1.0830 key support level.
AUDUSD – Aussie/dollar stays contained under resistance

The AUDUSD moved slightly lower last week, forming a bearish pin on the week, in-line with the bearish pin bar sell signal we discussed on Tuesday in our members commentary. If price holds under 0.7522 this week, we would expect to see more downside movement. Initial target at 0.7328, if that breaks, 0.7165 is the next support / target area. A close above 0.7522 would nullify our bearish bias for now.
GBPUSD – Sterling/dollar pulls back into support zone

The GBPUSD sold-off on Friday, entering the near-term support zone between 1.2828 and 1.2755; an area we have been looking to buy from recently. We are watching this downward pull back as a potential buying opportunity whilst price is above 1.2570 key support. We need to see a clear buy signal on the 4 hour or daily chart however, before entering long. If we don’t get a signal in the current support zone near 1.2755 – 1.2828, we will remain patient and watch for one closer down near 1.2570 area. Check our members trade setups newsletter this week for updates.
S&P500 – S&P500 hits fresh highs

The S&P500 continues to surge higher, in-line with the overall uptrend, notice last week it ended near fresh all-time highs. We can watch for any pull backs in the coming days to get long, in-line with the trend, whilst above 2320.00 area. Ideally, look to enter on a 1hr, 4hr or daily chart buy signal after a rotation lower.
Gold – Gold continues to gain ground after breakout

After breaking out and moving easily above 1240.00 resistance a couple weeks ago, Gold has continued to move higher, grinding modestly higher last week but ending near the week’s high. Momentum is clearly still bullish and we can watch for pull backs to support to get long this week. The key support / buy area this week is down near 1240.00 support but we can also look to get long above that level if an obvious 1 hour, 4 hour or daily chart price action buy signal forms after some downward movement (weakness).Website : https://nguyenphuochai.vn//
Mở TK HotForex: https://www.hotforex.com/?refid=116627
Mở TK Axitrader: https://goo.gl/iTGLce
Mobile : 0908950768 - Zalo - Viber
Không chia sẽ là hủy diệt- Sơn SVT
Tâm trạng không tốt-không trade ; thể trạng không khỏe -không trade


 Trích dẫn
Thông tin của chủ đề
Users Browsing this Thread
Có 1 thành viên đang xem chủ đề này. (0 thành viên và 1 khách vãng lai)
Similar Threads
-
Phân tích thị trường mỗi ngày cùng instaforex!
By InstaForex Dane in forum Forex và Hàng hóaTrả lời: 54Bài viết cuối: 08-06-2018, 01:53 PM -
Report Phân tích Cung cầu.... & Tín hiệu BBs.... hàng ngày....!!!!
By mayhong in forum Nhận định Thị trườngTrả lời: 17Bài viết cuối: 09-03-2010, 03:04 PM
 Quyền viết bài
- Bạn Không thể gửi Chủ đề mới
- Bạn Không thể Gửi trả lời
- Bạn Không thể Gửi file đính kèm
- Bạn Không thể Sửa bài viết của mình

Bookmarks