

Threaded View
-
10-05-2017 09:11 AM #11
- Ngày tham gia
- Mar 2016
- Đang ở
- https://nguyenphuochai.vn/
- Bài viết
- 2,011
- Được cám ơn 3 lần trong 3 bài gởi

Bounce or break? These pairs are sitting right on major support areas of consolidation patterns, still deciding whether to head further south or to go for a bounce.
EUR/GBP: 4-hour
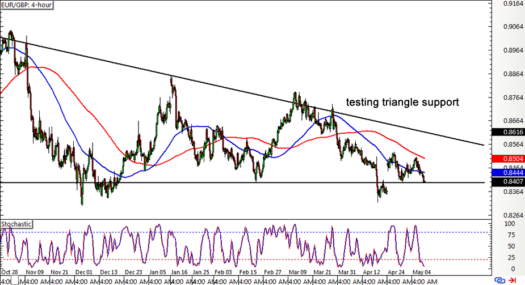
EUR/GBP is still stuck inside its descending triangle chart formation, but it looks like sterling has more fans than the euro as price could be due for a break of support around the .8400 handle.
The 100 SMA is below the 200 SMA on the 4-hour chart, indicating that selling pressure is in play. These dynamic inflection points could continue to keep gains in check even if the pair makes a quick bounce.
Don’t count euro bulls out yet, though, as stochastic is already in the oversold region and might pull up to draw buyers back in. If so, EUR/GBP could go for a test of the triangle resistance at the .8550 minor psychological mark.
Do keep your eyes peeled for a breakout, too! This particular formation is approximately 500 pips tall so the resulting rally or selloff could be of the same size. Wouldn’t wanna miss out on a move like that, right?
AUD/CAD: Daily
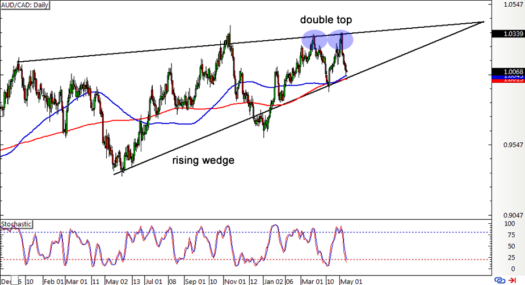
Here’s another pair that might be ready to break out soon! AUD/CAD is currently hovering at the bottom of its rising wedge visible on the daily time frame.
This area lines up with the moving averages, which could hold as dynamic support levels for the time being. The 100 SMA appears to have crossed above the 200 SMA so the path of least resistance is to the upside and that a bounce back to the resistance may be in order. At the same time, stochastic is approaching the oversold region so sellers might need to take a break.
However, I’m also seeing a small double top pattern right on the wedge resistance, which is a classic downtrend signal. I’d wait for a break of this pattern’s neckline around .9950 before going short and initially aim for a 350-pip target or the same height as the double top then go for the wedge height of around 800 pips next.
Forex Chart Settings:
Slow Stochastic: 14,3,3
100 SMA: Blue line
200 SMA: Red lineWebsite : https://nguyenphuochai.vn//
Mở TK HotForex: https://www.hotforex.com/?refid=116627
Mở TK Axitrader: https://goo.gl/iTGLce
Mobile : 0908950768 - Zalo - Viber
Không chia sẽ là hủy diệt- Sơn SVT
Tâm trạng không tốt-không trade ; thể trạng không khỏe -không trade


 Trích dẫn
Thông tin của chủ đề
Users Browsing this Thread
Có 1 thành viên đang xem chủ đề này. (0 thành viên và 1 khách vãng lai)
Similar Threads
-
Phân tích thị trường mỗi ngày cùng instaforex!
By InstaForex Dane in forum Forex và Hàng hóaTrả lời: 54Bài viết cuối: 08-06-2018, 01:53 PM -
Report Phân tích Cung cầu.... & Tín hiệu BBs.... hàng ngày....!!!!
By mayhong in forum Nhận định Thị trườngTrả lời: 17Bài viết cuối: 09-03-2010, 03:04 PM
 Quyền viết bài
- Bạn Không thể gửi Chủ đề mới
- Bạn Không thể Gửi trả lời
- Bạn Không thể Gửi file đính kèm
- Bạn Không thể Sửa bài viết của mình

Bookmarks