


-
11-09-2012 11:27 AM #1
- Ngày tham gia
- Oct 2009
- Bài viết
- 1,925
- Được cám ơn 617 lần trong 428 bài gởi
 Những series bài hay về phần mềm phân tích kỹ thuật MetaStock
Tập hợp những bài viết đỉnh về phần mềm phân tích kỹ thuật MetaStock
Bạn nào có bài gì hay post lên nhé

-
11-09-2012 11:29 AM #2
- Ngày tham gia
- Oct 2009
- Bài viết
- 1,925
- Được cám ơn 617 lần trong 428 bài gởi
Những series bài hay về phần mềm phân tích kỹ thuật MetaStock
Vài hướng dẫn khá thú vị về phần mềm phân tích kỹ thuật MetaStock
http://www.google.com.vn/url?sa=t&rc...ExAa5NFTFELDCw
-
12-09-2012 08:09 AM #3
- Ngày tham gia
- Oct 2003
- Bài viết
- 365
- Được cám ơn 215 lần trong 148 bài gởi
Những series bài hay về phần mềm phân tích kỹ thuật MetaStock
Đây là series những bài nghiên cứu chuyên sâu về phần mềm phân tích kỹ thuật MetaStock
RSI with EMA Strategy
Contributed by Robert W. Colby, CMT
In my 39 years of actual technical research experience, I have tested many of the analytical tools available. (Okay, so in my early years, I was testing different kinds of graph paper, rulers, and pencils). More than 22 years ago, I reviewed more than a dozen technical software programs for PC Magazine, Special Issue, April 15, 1986, Volume 5, Number 7. MetaStock was new then, practically a startup, but it stood out above the rest, and so I selected it as “Editors’ Choice”. 17 years later, I selected MetaStock software again for exclusive use researching for my 820-page book, The Encyclopedia of Technical Market Indicators, Second Edition, McGraw-Hill Publishing, 2003. I selected MetaStock for its wide-range of powerful capabilities, its flexibility, its ease of use, and its affordability.
While doing research for my book, I ran hundreds of optimizations, back tests, and forward tests. Since then, I since have run thousands more. It is my impression that these very powerful tools are widely misunderstood and underutilized by the great majority of investors and traders. In 2005, I gave an interview to TradingMarkets.com where I demonstrated an optimized version of a robust and very popular technical indicator, RSI 3 (buy below 30, sell above 70), combined with a long-term EMA filter of 330 days, for a simple mechanical trading system that offers moderately good performance with no subjective judgment. RSI alone is a relatively weak performer, but the addition of an EMA to filter the trades is the key to greater consistency of results. Which EMA? Optimize over past actual history to find out. The full MetaStock code is shown below. The chart shows the forward tested, real-time simulated performance of this same system applied to the S&P 500 continuous futures contract since January 3, 2007. Since the Buy Long signal on January 3, 2007, this RSI/EMA system is up 8.60%, significantly outperforming Buy & Hold (which is down 12.00%) by 2060 basis points. Of 24 signals, 66.67% were profitable, with 16 winners and 8 losers. See chart for the Cumulative Equity graphed against the raw closing price data.
The purpose of this demonstration is not to recommend any specific trading system. RSI, though very popular, is not the best indicator, and it certainly is possible to develop much better trading systems than the one shown in this example. My purpose is to show that by using powerful analytical software, such as MetaStock, combining common known indicators, optimizing parameters, back testing, and forward testing, it is possible to develop a trading system that can outperform going forward. More power to you!
RSI/EMA System Code
Enter long:
(RSI(C,opt1)<50-opt2
AND
C>Ref(Mov(C,opt3,E),-1))
AND Year()>2006
Close long:
(RSI(C,opt1)>50+opt2
OR
C<Ref(Mov(C,opt3,E),-1))
AND Year()>2006
Enter short:
(RSI(C,opt1)>50+opt2
AND
C<Ref(Mov(C,opt3,E),-1))
AND Year()>2006
Close short:
(RSI(C,opt1)<50-opt2
OR
C>Ref(Mov(C,opt3,E),-1))
AND Year()>2006
OPT1
Range: From 3 to 3 by 1
Current value: 3
OPT2
Range: From 20 to 20 by 1
Current value: 20
OPT3
Range: From 330 to 330 by 1
Current value: 330
Initial equity - 1424.8
Positions - Long and short
Entry trade price - Close
Entry trade delay - 0
Exit trade price - Close
Exit trade delay - 0
Entry commission - 0%
Exit commission - 0%
Interest rate - 0%
Margin req. - 100%
How can I run an Exploration to find Relative Strength Comparative values?
To construct a Comparative Relative Strength Exploration in MetaStock, please use the following steps below for your version of MetaStock:
MetaStock 8 – 10.1
With the newer versions of MetaStock this can now be done with the Security Data Function.
To construct a Comparative Relative Strength Exploration in MetaStock for Windows version 8.01 perform the following steps (This example will reference online data from Reuters DataLink, specifically the S&P 500):
Open the Tools menu
Select the Explorer
Click New
Name it Relative Strength Comparative
Select the Column A tab:
Enter the following formula: C/Security(“ONLINE:.SPX”,C)
Click OK
Run the Exploration
The results are displayed in the exploration report. They can be ranked by selecting the column header.
MetaStock 6.52 – 7.X
In versions of MetaStock for Windows prior to 8.01, this had to be done using the “P” variable and required you to open the chart of the index to be compared against.
To construct a Comparative Relative Strength Exploration in MetaStock for Windows, prior to version 8.01, perform the following steps:
Open the chart for the desired index.
Click to select the price plot (This will place small boxes on the prices to designate that the price has been selected)
Create a custom exploration for the Relative Strength Comparative
Open the Tools menu
Select the Explorer
Click New
Name it Relative Strength Comparative
Select the Column A tab
Enter the following formula; C/P (Note: The P variable references the selected indicator in the active chart which would be the close)
Click OK
Run the Exploration
The results are displayed in the exploration report. They can be ranked by selecting the column header.
The Rahul Mohindar Oscillator
What sets MetaStock apart? Well, succinctly stated from the unbiased perspective of the MetaStock sales team; “a lot”. MetaStock feature after MetaStock feature has become the industry standard. Data, charting, back testing, speed and power of , the Explorer, the Expert Advisor, user defined analytics, 150 indicators and line studies, performance systems, unsurpassed support that is free for life… the list goes on and on. One of the most popular, if not revolutionary, features has been the legendary Rahul Mohindar Oscillator (RMO).
The RMO was developed by the famed trader and CNN and CNBC India analyst Rahul Mohindar. It took Asia by storm and now, as released by MetaStock, has become a worldwide phenomenon.
The RMO uses five indicators to detect the correct overall trends in financial markets. It uses multiple criteria to identify a trading opportunity – and provides rules for getting out of a trade; working across any timeframe for a wide variety of securities including stocks, commodities and FOREX.
No system is “one size fits all” or can claim the merits of a crystal ball but the RMO has been successful for legions of users giving them high levels of confidence in their trades by getting them in with the primary trend while keeping a close eye on the swing in the market and market sentiment.
As one customer told me, “The RMO system is truly a winner…the RMO Buy/Sell signals have been fantastic.”
What sets MetaStock apart? The RMO has been a very powerful tool for many, many users and is exclusive to MetaStock. If you are looking for a little more of a trading edge; check out the RMO in MetaStock 10.
Call (800) 587-8014 if you have questions about how MetaStock will improve your trading odds using the RMO or any of our 26 trading systems and unparalleled tools.
Contributed by Greg Allred
-
12-09-2012 08:15 AM #4
- Ngày tham gia
- Oct 2003
- Bài viết
- 365
- Được cám ơn 215 lần trong 148 bài gởi
Những series bài hay về phần mềm phân tích kỹ thuật MetaStock
Đây là series những bài nghiên cứu chuyên sâu về phần mềm phân tích kỹ thuật MetaStock
Combining Relative Strength and Other Technical Indicators
Contributed by Michael Carr
Technical analysts have spent decades creating formulas designed to give them a trading edge. Many are based upon the principle that changes in momentum will occur before changes in price trend, in other words technicians are saying that Relative Strength (RS) in a stock’s past performance is a good indicator of future price appreciation. Examples of technical indicators include stochastics, the moving average convergence-divergence indicator (MACD), and the Relative Strength Index (RSI).
RSI was introduced to the world by Welles Wilder in 1978. It is among the most popular momentum oscillators used by technicians, and is a very useful component in many trading strategies. The RSI compares the strength of a stock's recent upside movement to the magnitude of its recent losses and provides that information as a single value that ranges from 0 to 100. However, it is not a measure of comparative RS because it does not take into account the performance of other stocks or the market itself. The theory behind the RSI is that it will identify those times when a stock has moved too far, too fast and is due to exhibit mean reverting behavior causing a reversal of the current trend. It is intended to spot tops and bottoms rather than find stocks that are starting to move higher for an extended period of time, as RS seeks to do.
MACD measures the difference between a short-term and long-term moving average of closing prices. The longer moving average is subtracted from the shorter moving average. The theory behind this indicator is that this calculation of a stock’s momentum will show when prices are changing directions. A positive value of MACD indicates that the short-term MA is trading above the long-term MA. A negative MACD indicates the opposite. If MACD is positive and rising, then the gap between the two MAs is widening, which means the rate of change of the short-term MA is higher than the rate of change for the long-term MA. This should lead to higher prices for the stock. If MACD is negative and declining further, then downward momentum is accelerating, and lower prices are to be expected.
The MACD indicator has been adapted as a measure of RS by Christopher Hendrix, CMT.ii Hendrix substitutes a RS calculation for price into the traditional MACD formula and creates a Momentum of Comparative Strength (MoCS) formula:
MoCS = (12-period EMA of (Stock/S&P 500)) – (26-period EMA (Stock/S&P 500))
where EMA represents an exponential moving average
Stock represents the closing price of the stock being evaluated
S&P 500 represents the close of the S&P 500 Index
An exponential moving average (EMA) is used by some market technicians to reduce the time lag introduced with simple moving averages. When using a moving average to smooth the data and help identify the trend, some delay is introduced into the price series. EMA's reduce the lag by overweighting the importance of more recent prices, with the amount of overweighting determined by the specified period of the EMA. Shorter period EMAs overweight the most recent price more than longer period EMAs. In the MoCS formula, the most recent close accounts for 15 percent of the value of the 12-period EMA, and the 26-period EMA derives about 7.5 percent of its value from the most current price. Because it puts more weight on recent prices, an EMA will react quicker to recent price changes than a simple moving average which equally weights all data points.
Trading signals are generated when a 9-period EMA of the MoCS crosses above or below the current value of the MoCS. An example is shown in Figure 1. Buys are signified when the solid line is above the dotted line, sell signals are the reverse. The advantage of MoCS is that it compares the movement of a stock to the overall market but allows the investor to apply a RS strategy to a single security, rather than requiring that an investment universe be rank ordered and sorted into percentiles. The chart shows there are clear buy and sell signals based only upon the behavior of this stock compared to the market.
Figure 1: Modifying the formula of the well-known MACD technical indicator to measure RS allows an investor to see clear buy and sell signals for an individual security. The Momentum of Comparative Strength (MoCS) indicator is shown in the bottom panel of this figure. In this case, a buy signal occurs when the solid line crosses above the dashed line, and a sell occurs when the solid line falls below the dashed line.
As can be seen in Figure 1, MoCS offers timely signals. Its sell signals are usually closer to the top than the signals given by other indicators. Traditional oscillators give a large number of false signals. Using weekly settings for MoCS provides very few signals, and even fewer losing trades.
This technique can be applied to any technical indicator by adapting the formula to use a RS ratio instead of the stock’s closing price. It is a highly adaptable strategy which can employ RSI, or stochastics, for example, instead of using MACD. Alternatively, investors can change the time periods for MACD to generate a greater or lesser number of signals.
Wilder, J. Welles, New Concepts in Technical Trading Systems, Trend Research, 1978.
ii ‘It’s Like Spreading Peanut Butter & Jelly,’ Christopher P. Hendrix, CMT, SFO Magazine, November 2006.
Michael Carr has been trading for more than twenty years and is a Chartered Market Technician (CMT). Carr began researching relative strength trading more than a decade ago and after retiring from the U.S. Air Force as a Lieutenant Colonel, he became a full-time relative strength investor. He is the editor of the Market Technicians Association (MTA) monthly newsletter, Technically Speaking, and associate editor of the MTA's scholarly publication, Journal of Technical . Carr also serves on the board of directors of the MTA Educational Foundation. His work has been published in SFO, Futures, TRADERS , and Working Money. He is also the author of Smarter Investing in Any Economy: The Definitive Guide to Relative Strength Investing (www.w-apublishing.com), from which this article is extracted.
Back to top
Support Tip
How can I backup my formulas? (Indicators, Experts, Explorations & System Tests)
Contributed by Equis Support
All of your formulas can be quickly backed up by the following procedure:
Open MetaStock
Click Tools | Indicator Builder
Click Organizer
Click Export
For each of the formula based tools, select the items to be backed up.
Specify the location you wish to export the files to. You can password protect them here, but we advise you not to unless you are distributing them to other people you do not want to have access to the formula code.
Click OK
This will back up the selected formula files in the destination location you specify. Although safe guards are put into place to in MetaStock to mitigate loss of data, backing up your work provides you with additional peace of mind; therefore we recommend that you regularly back up your work.
Back to top
MetaStock Features
MetaStock Scanning
Contributed by David Derricott
One of the most commonly used features in MetaStock is the ability to scan. This is a very powerful and useful part of the program. It’s a great way to find securities you want to trade, will help you decide when to trade, and if you should stay out of the market. A very simple and easy scan you can create using MetaStock is scanning for buy and sell signals when a moving average crosses above or below the price bar over the last 20 days.
Another great part of the scanner is the ability to make the scans as simple or as complex as you would like. MetaStock has about 40-50 pre-programmed scans included in the software. You can use historical data to back test these scans to see how they perform over any given period of time. Once you have determined which scans work best for you, you can apply these to your trading portfolio. MetaStock provides data for 30 years on daily charts and one year on intraday charts. The scanning capabilities within MetaStock work well for both end of day traders and real time traders. It doesn’t matter if you trade stocks, options, futures, or forex the program will work great with all markets.
If you would like assistance with setting these scans you can contact our support team. We offer world class support and all our representatives are very knowledgeable and will spend as much time as needed to assist you with your questions and problems. In the past year MetaStock support representatives have answered 85% of their calls in two minutes or less. You can contact the support department via phone, email, or online using our support chat feature.
For more information regarding the scanning feature found within MetaStock, please contact David Derricott directly at 800.587.8012 or via email at david.derricott@thomsonreuters.com.
-
12-09-2012 10:42 AM #5
- Ngày tham gia
- Aug 2010
- Bài viết
- 648
- Được cám ơn 325 lần trong 218 bài gởi
Những series bài hay về phần mềm PTKT phân tích kỹ thuật MetaStock
Đây là series những bài nghiên cứu chuyên sâu về phần mềm PTKT phân tích kỹ thuật MetaStock
Bollinger Band Basics
Contributed by John Bollinger
Bollinger Bands are available on MetaStock and most charting software. They have become popular primarily because they answer a question every investor needs to know: Are prices high or low?
What are Bollinger Bands? They are curves drawn in and around the price structure on a chart providing a relative definition of high and low. To wit: Prices near the upper band are high, prices near the lower band are low.
The base of the bands is a moving average that is descriptive of the intermediate-term trend. This average is known as the middle band and its default length is 20 periods. The width of the bands is determined by a measure of volatility called standard deviation. The data for the volatility calculation is the same data that was used for the moving average. The upper and lower bands are drawn at a default distance of two standard deviations from the average.
These are the standard Bollinger Band formulas
Upper band = Middle band + 2 standard deviations
Middle band = 20-period moving average
Lower band = Middle band - 2 standard deviations
Here is an example of Bollinger Bands applied to a chart:

To teach you how to use Bollinger Bands effectively would take a book, however the following rules serve as a good beginning point.
15 Basic Rules for Using Bollinger Bands
1. Bollinger Bands provide a relative definition of high and low.
2. That relative definition can be used to compare price action and indicator action to arrive at rigorous buy and sell decisions.
3. Appropriate indicators can be derived from momentum, volume, sentiment, open interest, inter-market data, etc.
4. Volatility and trend already have been deployed in the construction of Bollinger Bands, so their use for confirmation of price action is not recommended.
5. The indicators used for confirmation should not be directly related to one another. Two indicators from the same category do not increase confirmation. Avoid colinearity.
6. Bollinger Bands can be used to clarify pure price patterns such as M-type tops and W-type bottoms, momentum shifts, etc.
7. Price can, and does, walk up the upper Bollinger Band and down the lower Bollinger Band.
8. Closes outside the Bollinger Bands can be continuation signals, not reversal signals--as is demonstrated by the use of Bollinger Bands in some very successful volatility-breakout systems.
9. The default parameters of 20 periods for the moving average and standard deviation calculations, and two standard deviations for the bandwidth are just that, defaults. The actual parameters needed for any given market/task may be different.
10. The average deployed should not be the best one for crossover signals. Rather, it should be descriptive of the intermediate-term trend.
11. If the average is lengthened the number of standard deviations needs to be increased simultaneously; from 2 at 20 periods, to 2.1 at 50 periods. Likewise, if the average is shortened the number of standard deviations should be reduced; from 2 at 20 periods, to 1.9 at 10 periods.
12. Bollinger Bands are based upon a simple moving average. This is because a simple moving average is used in the standard deviation calculation and we wish to be logically consistent.
13. Be careful about making statistical assumptions based on the use of the standard deviation calculation in the construction of the bands. The sample size in most deployments of Bollinger Bands is too small for statistical significance and the distributions involved are rarely normal.
14. Indicators can be normalized with %b, eliminating fixed thresholds in the process.
15. Finally, tags of the bands are just that, tags not signals. A tag of the upper Bollinger Band is NOT in-and-of-itself a sell signal. A tag of the lower Bollinger Band is NOT in-and-of-itself a buy signal.
These rules outline the basic guidelines for using Bollinger Bands. For a more comprehensive understanding of the bands, I suggest that you read “Bollinger On Bollinger Bands”. The book starts with the basics, builds to the complex and teaches the technical process including which indicators to use and how to read charts.
The Bollinger Band Tool Kit for MetaStock provides easy to use implementations of all the trading systems and indicators from the book.
John Bollinger, CFA, CMT is probably best known for his Bollinger Bands, which have been widely accepted and integrated into most of the analytical software currently in use. He is the president of Bollinger Capital Management, a money management firm, and publishes a monthly newsletter, The Capital Growth Letter. He has eight financial websites: www.BollingerBands.com, www.BollingerOnBollingerBands.com, www.EquityTrader.com, www.FundsTrader.com, www.GroupPower.com, www.MarketTechnician.com, www.PatternPower.com and now a forex site, www.BBForex.com.
Support Tip
How can I find and delete local securities that are no longer trading?
Contributed by Equis Support
A good technical trader regularly cleans up the symbol lists they use for trading. Creating an exploration to identify securities that are no longer trading takes just a moment and saves you time in the future. The following method identifies securities that are no longer trading and provides a way to easily remove them from your lists.
Create a new exploration with the following formula:
Col A name: month, Col A formula: Month()
Col B name: day, Col B formula: DayOfMonth()
Col C name: year, Col C formula: Year()
Filter ( (Year() < 2009) OR (Month() < 2) )
Run the exploration. The results will be the securities that are no longer trading. Select all of the results and delete them.
Below is a step by step process of how to create this exploration:
1. Open MetaStock
2. Open the Tools menu
3. Select The Explorer
4. Click New
5. Name the new exploration (we suggest "no longer trading")
6. In Column A, type in the following:
- name: month
- formula: Month()
7. In Column B, type in the following:
- name: day
- formula: DayOfMonth()
8. In Column C, type in the following:
- name: year
- formula: Year()
9. In the filter column, type in the following
- ( (Year() < 2009) OR (Month() < 2) )
- Note: you'll want to change the '2009' and '2' to the current year and month before you run this exploration.
10. Click OK
11. Click Explore
12. Add your data folders to the Select Securities dialog
13. Click OK
14. Click Reports when complete and select the Results tab
15. Select the first security, hold down the Shift key and click on the last security
16. Right click on the selected securities
17. Select delete securities
MetaStock Features
The RMO ATM
Contributed by Devin Ekberg
With the recent highly turbulent financial markets, it is extremely important to consider volatility and volume as part of a trader’s technical . Volatility is defined as the relative rate at which the price of a security moves up or down, and is calculated using a statistical method of standard deviation. Volatility can be a trader’s best friend or worst enemy depending on how his/her accounts for it.
Most traders expect to make money quickly and easily; knowing when markets are dormant, active, or hyperactive can mean the difference between a fast moving profit and a slow churning loss. The RMO ATM add-on for MetaStock contains many templates and strategies for measuring volatility, including a set of indicators called “Zone Detector” and “Zone Fill” (See Figure 1 below).

The Zone Detector (dark green line) ranges from 0-1 indicating a period of sufficient activity (1) or insufficient activity (0). A value of one indicates enough activity is present to move the price action in either direction quickly and efficiently. When the value is zero, a trader is more likely to experience a sideways or choppy movement in price action.
The Zone Fill (light green histogram) is a secondary measure suggesting the activity is not only favorable for a trade, but also considered “hyperactive” and a trader can feel more comfortable with a larger position or more aggressive profit target.
These two indicators can be used along with the other strategies in the RMO ATM add-on as a filter for executing only the trades with the highest probability for success. Imagine a mechanism keeping one’s money out of the capital-draining choppy markets, and only in efficiently trending markets.
The RMO ATM was created by Rahul Mohindar, who is best known for his RMO Trade Model template in MetaStock 10. I have many clients who have given superb feedback in these strategies even in the most unpredictable financial markets of our lifetimes. If you have any questions about this product or others, you may contact me anytime for more detailed information. Until then, I hope your trading is successful.Last edited by tradingpro8x; 18-09-2012 at 08:36 AM.
-
12-09-2012 02:27 PM #6
- Ngày tham gia
- Aug 2010
- Bài viết
- 648
- Được cám ơn 325 lần trong 218 bài gởi
Những series bài hay về phần mềm phân tích kỹ thuật MetaStock
Đây là series những bài nghiên cứu chuyên sâu về phần mềm PTKT phân tích kỹ thuật MetaStock
A New Look At A Decades-Old Tool
Contributed by Don Fishback
There's been a lot of talk lately about models, probability and statistics. The reason is manifold, but it all distills down to what's going on in the banking and financial sector. You see, nearly every major decision in national and global-scale finance - whether it was the ability of a group of borrowers to pay back loans, the amount of capital banks were required to keep, the amount of collateral required to provide credit default insurance, or the value of certain derivatives - is based on a probability model.
A contemporaneous example is the so-called "bank stress test". Regulators disclosed the methodology for the stress test in late April. In that disclosure, they said, " of [commercial and industrial] loan loss projections was based on the distribution of exposures by industry and by internal rating provided by the firms. In many cases, these ratings were mapped to default probabilities by the firm; in other cases, this association was established by supervisory analysts. This information was confirmed and supplemented by external measures of risk, such as expected default frequencies from third party vendors. Supervisors evaluated firm loss estimates using a Monte Carlo simulation that projected a distribution of losses by examining potential dispersion around central probabilities of default."
A Monte Carlo simulation works by randomly generating inputs going into a model (or formula or equation), and then evaluating all the results. The first step in the process of using a Monte Carlo simulation requires that you create the model. Obviously, that's important. The second part is equally important. It requires you to answer this question: How do you generate the random numbers? To do that, you need to select a "domain" or "distribution". There are many different types of distributions out there: uniform, binomial, triangle, etc. One of the most widely used, and the one that is used in the financial arena more than any other, goes by several different names: Gaussian, normal or bell-curve.
In finance, we typically add a complication, and that is to express movements in terms of logarithms. Personally, I like to keep things simple, so I would hesitate to add anything making it more difficult. But the addition of the logarithm does have a purpose. The reason we express movement in terms of logarithms as opposed to percentages is because a 50% loss and a 50% gain are not necessarily the same thing. Think of a stock at 100. If it loses 50% and then gains 50%, the stock goes from 100 down to 50 up to 75. Instead, a 50% loss and a 100% gain are the equal-magnitude inverse of each other. If the stock goes down 50%, then up 100%, then the path is from 100 down to 50 and back to 100. You get the same result if the path reverses going up 100% first then down 50%. The stock starts at 100, then up to 200, then back down to 100. The net of all of this is that the natural logarithm of 0.50 (-0.69315) is the inverse of the natural logarithm of 2.00 (+0.69315).
Now back to the bell curve that is used in financial Monte Carlo simulations and derivative pricing. One of the interesting properties of the bell curve is that it gives us the ability to calculate probabilities, as shown in the following graph:
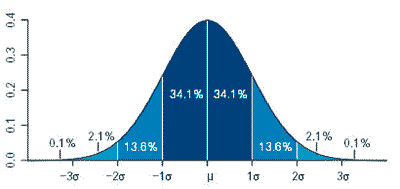
x-axis is expressed in terms of standard deviation. Graph produced using R by Jeremy Kemp
As you can see, there are certain probabilities associated with different standard deviations. That's important, because standard deviation is associated with something else that we as traders are well aware of: volatility. You see, volatility is equal to the annualized standard deviation of the asset.
That means, if we know an asset's volatility, we can use certain formulas to calculate probability.
That's where the ODDS Probability Cone, developed over a decade ago, comes in. This indicator -- unique to MetaStock -- has those formulas built into it, allowing you to easily visualize probability.
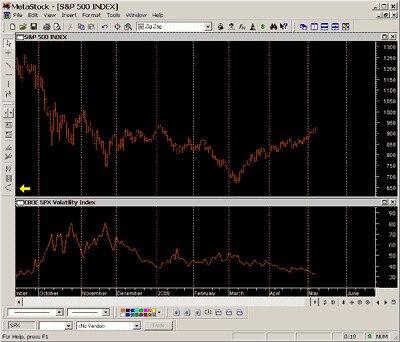
Below is a chart of the S&P 500 Index plotted with the CBOE Volatility Index (VIX). The VIX is a measurement of expected volatility of the S&P 500 Index over the next 30 days. That expectation is implied by the prices of S&P 500 Index options. Also shown in the chart is a yellow arrow pointing to a parabolic shape in the Line Studies toolbar. That's the ODDS Probability Cone.
If you click on the parabola, your cursor becomes a cone-shaped indicator that you can move across the chart. Simply move the indicator to where you want to do the , and you're ready to set the parameters, as shown in the next graphic.
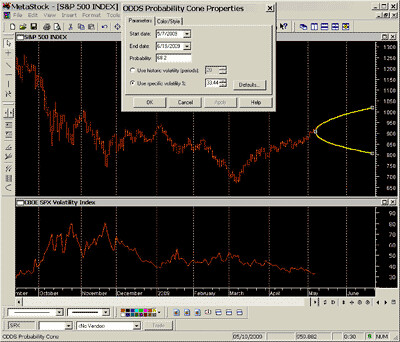
Once you've placed the cone where you want it, simply double click it and see the dialog box that allows you to set the dates, the probability and the volatility. In this particular instance, I set the date from May 7 to the June options expiration, June 19. I set the volatility to the specific value of the VIX that day. And I set the probability to 68.2% -- the level corresponding with +/- 1 standard deviation. Once I've set the parameters, MetaStock performs the calculations I created, and the ODDS Probability Cone (shown in yellow) is drawn. By scrolling across the indicator, you can get the Cone values at different points in time, as shown in the next graph.
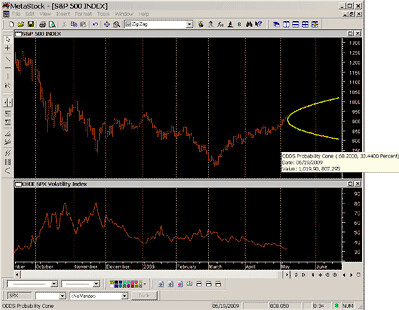
As you can see, when the cursor is placed on the Cone at 06/19/2009, the values are 1019.90 and 807.295. That means, based on an expected volatility of 33.44, there is a 68.2% chance that the index will be in between those two values on that date, which is when the June options expire. There is a 31.8% chance the index will be outside that range on June 19.
Not only can we look at 68.2/31.8, the probabilities associated with +/- 1 standard deviation, we can look at other probabilities as well. For example, we can look at 50/50 (green), 80/20 (blue), or 90/10 (orange).
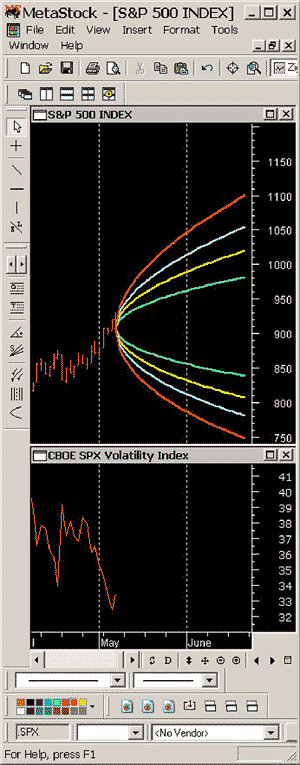
To option traders, this provides vital information, as it allows us to visualize the expected probability of a certain-size market movement. By looking at this chart, we can see that the market is expecting a 90% chance the S&P 500 will be within 750 and 1100 at June options expiration.
So when you look at all that's going on in the banking and the markets today, with the stress tests and the attempts at pricing derivatives, realize that one of the tools those folks are using is built into MetaStock so you too can determine probabilities quickly, easily and visually.
-- Don Fishback
A couple of caveats: First, this is a simplified explanation meant to highlight the major factors and the features of the indicator. A more comprehensive explanation requires a lot more math, and this simply isn't the forum for that discussion. Second, the formulas used to calculate the ODDS Probability Cones are based on the assumption that the stock market follows a logarithmic, normal distribution. No asset actually follows that distribution perfectly. But it is a useful representation when applied to an asset class such as a broad-based stock index. Just remember these words from statistician George Box, "All models are wrong, but some are useful."
ODDS(r) is a registered trademark of Donald M. Fishback, Jr.
About the Author - Don Fishback is the creator of ODDS® – Options and Derivatives Decision Support. ODDS is a method for analyzing options and other derivatives based on a unique method for balancing risk, reward and probability. The key to this approach is volatility, which is the way most people look at options, plus magnitude over time. Don’s oddsonline.com software provides traders with his unique Measure, Don’t Model™ tools. Not only does ODDS Online calculate probabilities based on the most commonly used option pricing models, but it also incorporates actual measurements of stock price movement to evaluate option strategies. A 25 year veteran of the derivatives business, Don spent many years on the conference and lecture circuit. Now he prefers to spend his time at home with his family.
Back to top
Support Tip
How can I restore the back-up copy of my custom formulas?
Contributed by Equis Support
How can I restore the back-up copy of my custom formulas?
Open MetaStock
Click Tools | Indicator Builder
Click Organizer
Select "Import formula files", then click Next
Specify the location you wish to import the files from
Click Finish
All of the formula files, experts, explorations, and system tests will be read from and added to the current installation location for MetaStock.
If you already have formulas, experts, explorations, and system tests of the same name in MetaStock, you will be asked if you want to replace them. If you say yes, the import will finish, overwriting the formulas of the same name. If you say no, the import will be halted and no custom formulas will be restored.
Back to top
MetaStock Features
Fire Plug-In
Contributed by Ken Spelman
One of our best plug-ins for broad market is also one of the least understood; Fire. Fire is a tool that allows you to calculate and plot breadth indicators on sectors and industry groups rather than the market as a whole. A breadth indicator is a specific type of indicator using advancing and declining issues to determine the amount of participation in the movement of the stock market.
Fire allows you to perform External Relative Strength (also known as ERSA). ERSA is a concept that measures how a stock’s price has performed versus all other stocks in the selected group over a specific time frame. Fire allows you to customize your by choosing the stocks you group together to calculate an array of breadth indicators over any time period. You can then plot your results in MetaStock for more .
Fire is the only program that will allow you to easily create your own custom index. With Fire’s custom indices tool, you’ll get quick calculations on the average open, high, low and close of all the securities in the folder you create.Last edited by tradingpro8x; 18-09-2012 at 08:35 AM.
-
12-09-2012 05:34 PM #7
- Ngày tham gia
- Aug 2010
- Bài viết
- 648
- Được cám ơn 325 lần trong 218 bài gởi
Những series bài hay về phần mềm PTKT phân tích kỹ thuật MetaStock
Đây là series những bài nghiên cứu chuyên sâu về phần mềm PTKT phân tích kỹ thuật MetaStock
The Downtrend and Uptrend are Not Created Equal
Contributed by Martha Stokes, C.M.T.
There are many myths perpetuated in the trading world. One such myth is that if you know how to trade the uptrend or the buy side of the market, then you can easily switch and trade the downtrend or sell side of the market. All too often, Retail Traders assume the two are mirror images of each other. Unfortunately, this often leads to problems for traders who want to sell short.
The downtrend is significantly different in price action than the uptrending market. Here are some aspects of downtrending price action every trader needs to understand and recognize to improve their sell side trading:
The Market Participants who trade the downtrending market are a different mix than those who trade the uptrending market and do so for very different reasons. Since the late 1990’s, the levels of Market Participants have expanded and we now have 8 groups of Market Participants each with their own agenda for investing or trading stocks. On the uptrend, the Institutional Investor dominates price action. During a downtrend, the Institutional Trader controls the action. Since each of these groups has entirely different buying and selling agendas, price action is impacted often in dramatic ways. Understanding this phenomenon helps the Retail Trader know what kinds of entry signals to look for, the patterns to watch for in institutional indicators, and what kinds of exit signals and strategies to use for both stock and option trading.
Stocks require strong volume patterns to move up, so a continued increase in volume is necessary for the uptrend to sustain. On the downtrend, stocks can and do fall even on low volume patterns. This is especially true during the secondary and final phases of the downtrend. Retail Traders need to adjust their volume indicator settings to accommodate the variances between the uptrend and the downtrend. Volume bars should be used with a sub-indicator, either a moving average or rate of change and the settings need to be significantly tighter on the downside to achieve an accurate of volume to the downside.
To the downside, the angle of descent is far more vertical and occurs more frequently than the angle of ascent. The angle of descent can maintain a vertical drop longer than the angle of ascent. When a trader understands this phenomenon and is expecting it, then they are able to make adjustments to their exit strategies and indicator to keep them in the trade for higher point gains. Since the angle of descent is steeper, the sell side tends to move faster with far more momentum, even on lower volume. This creates different Trendline Patterns to the downside. Traders should expect to see tighter consolidations with dramatic stairstep patterns that are longer than upside stairstep patterns. The runaway trendline pattern will also occur more often to the downside than to the upside.
Traditional textbook theory on bear market trends identifies 3 phases of a bear market; however, today’s bear markets tend to have more than 3 phases. Bottoming patterns are more complex and gaps are more common. Retail Traders also need to watch out for more frequent bounces. During the first phase of a bear market or major correction, price action will be at its steepest. In recent years, the final move down of major corrections tends to fizzle out rather than the huge dramatic drops that occurred in prior decades.
The initial downtrend phase is an important area for retail traders to recognize to enter just as the topping action completes. Often Retail Traders are not aware of the topping action and miss the highest point potential of the downtrend. Conversely, during the early stages of a market bottom, Retail Traders are often attempting to sell short while institutional investors are quietly accumulating.
Here are a few tips to help you with your selling short trading:
Whenever any financial market, whether it is stocks, bonds, options, or forex go vertical and sentiment has gone over 90% to the upside, start watching for one of the 5 topping patterns and shift your mindset in preparation for selling short. Choose 1-3 sell short entry signals, adjust your indicators, and start setting up for selling short. Wait for the drop in volume on the final move up.
The Institutional Investors tend to exit the stock, index, or other instrument prior to the final move up. The small investor and late comers create that vertical extreme peak pattern on falling volume. If the stock, index, or other instrument doesn’t make a higher high and higher low on rising volume, then you have an initial topping pattern developing. Be aware that the late buyers coming in will “buy on the dip” with ‘market orders’ rather than controlled orders and this can cause a big bounce. Watch for this pattern.
Do not keep your stop loss too tight, allow for normal overlapping that forms in downtrend price action. Falling price action tends to overlap far more than upside price. If you keep a very tight stop, you will get whipsawed out of the sell short or option put prior to the major move down. Overlapping on downtrending stocks occurs because even as the Institutional Traders move in to control the downside action, late uninformed small lot buyers are rushing to buy with ‘at market’ orders. This creates a surge of pre-market orders allowing market makers to gap price up at market open, then as the large lot sellers move in, price drops quickly. The more popular the stock, the more overlapping of price action there will be when small lot late buyers meet Institutional Traders selling short.
When a stock drops below $15.00, it has less profit potential for selling short. Retail Traders need to be vigilant during the final phases of a downtrend to monitor the activity of the Institutional Investors who will move in quietly without disturbing price much. Once their counterparts, the Institutional Trader, finds out about the quiet accumulation, speculative bottoming action will occur. Often times Retail Traders have delayed selling short during a downtrend and jump in just as the stock is about to begin a bottom. If a stock has fallen 40%-50% or more, then it is usually not an ideal candidate for selling short.
Keep a 3/1 Profit Point to Risk ratio when selling short. The sell side offers a much higher profit potential per trade than the buy side, however, the risk is also greater as bounces can wipe out profits quickly. By choosing only optimal picks with a higher profit to risk ratio, you lower your overall risk and raise your profit potential.
Do not choose weaker picks with lower profit to risk ratios simply to have something to trade. If you can’t find ideal picks, then stop and accept the fact that the market is telling you something important. Often when you aren’t able to find picks with good profit to risk ratios the market is right on the cusp of a major upside shift.
Summary: The sell side is different than the buy side of the market. It has a much faster moving price action in the early stages of the downtrend, but it also has overlapping patterns not seen as frequently when stocks are trending up. The matrix of Market Participants—who is buying, who is selling, who is buying to cover, and who is selling short differs on the sell side to the buy side and impacts price action. When a trader understands these often subtle differences and can see the patterns on the price chart, they are on their way to mastering the sell side and becoming an expert trader.
About the Author:
Martha Stokes, C.M.T. is the co-founder and CEO of TechniTrader®, an educational firm dedicated to helping small investors and retail traders. Since 1998, TechniTrader® has taught thousands of beginners to professional level traders how to be consistently successful in the stock and option markets.
Martha’s fascination with the markets and business started at the age of nine. She made her first investment while still a teen. Her theory on Cycle Evolution is a landmark work on financial cycles. She has been involved in several startups and has sat on both sides of the Venture Capital negotiating table, worked on an IPO, managed a small fund, taught at community colleges, and has been a guest speaker at numerous seminars and investment groups including the Boeing Employees Investment Group. She has been a guest on the CFRA radio Ottawa Canada.
Her long list of educational work includes: 15 stock, investing, and option courses, 16 semester length Lab Classes, her Annual New Technology Reports, Sector and Industry, and Special Edition Reports, hundreds of articles, resource papers, and white papers. Martha writes 6 newsletters each week and still finds time to answer student questions.
www.technitrader.com
www.marthastokes.com
www.technitraderblog.com
TechniTrader Twitter Page
TechniTrader Facebook Page
Back to top
Support Tip
Updating Your Symbol Utility - Symbol Database
Contributed by Equis Support
The stock market is dynamic and symbols are constantly being changed, removed, or created. In order to keep up with the symbol changes, Equis updates the symbol file found within its symbol database. The Symbol Utility reflects those changes. It allows customers to automatically update the symbols in their “Local Data” view in the Open dialog on a monthly basis without having to manually change each symbol within each folder on their hard drive.
How to update the Symbol Database built into MetaStock.
Open MetaStock.
Select Tools – “Update Symbol Database”.
When you get the message “patch successful” select Close.
Close and restart MetaStock.
How to install the Symbol Utility for Reuters DataLink.
Go to: http://www.equis.com/customer/suppor...olutility.aspx
Read the warnings and agree to the terms and select “Download RDL file”.
When prompted select “Save”, this will open the “Save As” window. Using the drop down menu select the “Desktop” for the “Save In” then select “Save”.
When the download is complete close out of the Symbol Utility web page.
On your desktop you will have a new icon named “RDL_Symbol_Utility.exe” double click onto the file and select “Run”.
The extractor window will appear showing the unzip folder path as C:\MetaStock Data, next select “Unzip” to begin the extraction process.
Follow the steps below to download historical data from Reuters DataLink.
Open the DownLoader.
From the Tools menu in The DownLoader select “Download Prices”.
This will open the Select Securities window. On the left hand side of the folder tree, expand the C drive and highlight the MetaStock Data folder and select “Add all Subfolders” and select OK. This will add the folders and symbols created by the Reuters DataLink Symbol Utility for a data download.
Select “OK” on the Select Securities window and the Vendor Selection window opens. Make sure the Reuters DataLink tab is forward in front and select OK to begin a data download.
Back to top
MetaStock Features
The ETS Trading System
Contributed by Greg Allred
In today’s marketplace, there is a lot of confusion and bad trades being executed. The common systems and methods used in past years do not seem to work as well in today’s market conditions. ETS Trading System can create clarity in today’s uncertain market conditions and help shift the odds in your favor.
ETS Trading System does an excellent job of providing very clear and easy to read buy and sell signals. The system will display protective stops, trailing stops, and profit targets. Many systems only work on an end-of-day or intraday basis but this system works well for both time frames. ETS Trading System has two experts: ETS Basic and ETS Complex. The complex expert includes profit targets and protective stops for long or short trades. This system works with stocks, options, indices, futures, and FOREX. ETS Basic gives you clear and precise buy and sell signals.
The powerful tools ETS offers helps you eliminate the stress and emotion most people experience while trading. Whether you are a new or experienced trader, ETS can help avoid costly decisions and mistakes. The program comes ready to use out of the box and is easy to use. Help put your trading on the right side of the markets by adding these valuable tools to your collection.Last edited by tradingpro8x; 18-09-2012 at 08:35 AM.
-
13-09-2012 09:16 AM #8
- Ngày tham gia
- Aug 2010
- Bài viết
- 648
- Được cám ơn 325 lần trong 218 bài gởi
Những series bài hay về phần mềm PTKT phân tích kỹ thuật MetaStock
Đây là series những bài nghiên cứu chuyên sâu về phần mềm PTKT phân tích kỹ thuật MetaStock
Creating an Effective System: Acceleration Bands and Williams' Percent R
Contributed by Price Headley
For option traders, correctly forecasting short-term price action is imperative to long-term success and, in my view, technical is the best way to achieve this. Many would say the “Holy Grail” of technical is to find true “leading” indicators … those that point to directional movements and trends as they are occurring or before they occur, not lagging indicators that show what has already occurred. I’ve tested and designed hundreds of technical indicators over the years, and I want to share with you one of my trading systems that uses two of my favorite and time-tested indictors. The two indicators? One is Acceleration Bands, which I created. The other is Williams’ Percent R, which I have modified and created specific rules to utilize that are different than is seen in normal trading systems.
A major problem that many traders have is too many signals. In other words, their criteria needs to be tightened and refined. As many of you already know, I look for the Big Trends that rarely occur, this helps me leverage my capital while reducing the number of total trades. Now, don’t be fooled, there is no fool-proof system out there … so risk control is an important part of any technical system. In life, it's good to be an optimist, but excessive optimism in system development can easily lead to ignoring the risks and the weaknesses in your trading system. All systems have weaknesses. Make sure your systems have a risk control element to it.
Today I want to share with you a system that uses only two indicators, Acceleration Bands and Williams’ Percent R – remember keep your system simple. First, it’s important to describe each system independently to see the strength and weaknesses of each.
Acceleration Bands: Available in the MetaStock Big Trends ToolKit
Description: Adaptive bands that contain 95% of price action usually used in 20 or 80 bar periods. Trading signals occur when price action is confirmed outside the bands. This indicator targets the top 5% of moves, keeping traders focused on the best trends.
The 20 Bar Acceleration Band Expert Advisor (SPX chart below) shows buy and sell signals based on my system. Notice that in the 14 months shown, the S&P500 only exposed a signal 4 times, each was profitable. This depicts the 5% theory well – Acceleration Bands highlight only the extreme moves for option traders. The issue many traders face is really two-fold; many traders want more signals and the entry point can use some refinement. Like the Yin & Yang relationship, I’ve developed a system that combines Acceleration Bands with Williams’ Percent R to remove any weaknesses and refine trading signals. Let’s take a look at how it works.
Williams’ Percent R – Traditional indicator available in MetaStock. The Big Trends Willams’ %R is available in the Big Trends Toolkit with two separate systems based on breakout and retest (lower risk entries) methods. We have smoothed out and modified Williams’ Percent R to make it a better and more usable trading vehicle.
Descriptions: Larry Williams created the Percent Range oscillator to highlight overbought versus oversold levels in securities. Traditionally overbought connotates a long exit or sell short entry as oversold would insinuate the opposite, however, we in general consider overbought to be bullish and oversold to be bearish. The Big Trends Percent R system targets the top 20th percentile and bottom 20th percentile.
In the chart below we have the Expert Advisor for Big Trends ToolKit (BTTK) Percent R Retest System applied to the S&P500. My first impression is that there may be too many signals with 11 trades in 14 months (compared to 4 with the Acceleration Bands). The Percent R Retest System targets lower risk entry points by signaling buy or sell-short signals after a corresponding breakout confirmation occurs. These pullbacks, or retests, are patterns that help identify fast moving trades that are immediately profitable. If they do not move in the expected direction immediately an exit signal is triggered for effective risk control.
Notice that we also have 20 Bar Acceleration Bands applied to the price action -- my favorite system employs both Percent R and Acceleration Bands; reducing the number of trades while only trading the best pullbacks. I focus on Percent R retests within Acceleration Band signals. Let’s take a look at an example of this signal below.
Notice above that we also have 20 Bar Acceleration Bands applied to the chart (but not a part of the trading signals) -- my system employs both Percent R and Acceleration Bands; reducing the number of trades while only trading the best pullbacks. I focus on Percent R retests within Acceleration Band signals. Let’s take a look at an example of this signal below.
When developing a system I look for winners that are at least twice the size of losses and a minimum 50% winning average, however, I’ve found that 60% winning average is optimum and realistic. That’s why using Acceleration Bands and Willams’ Percent R has become one of my favorite two indicator systems. Acceleration Bands highlight extremely strong moves, while Percent R Retest Method highlights low risk entry points within those Accelerations. In addition, I found that this system works particularly well on individual stocks, which typically provide more Acceleration signals than market averages like the S&P500.
For ease of learning I want to show you a quick example of a signal using both indicators within the same time frame as the charts above on the S&P500. In the chart below we have the Acceleration Band Expert Advisor (20 Bar) exposing a sell-short signal based on momentum. Notice that in the days after extreme selling signals an Acceleration short signal, we see a bounce, or retest, in price action. This typically occurs from value seekers, however, we know that once the trend has Accelerated thus far it’s probable to continue.
The blue arrow shows us where Percent R initially confirms bearish activity (prior to Acceleration signal) , and we know that any Percent R spike above 20% is now a qualified retest. Furthermore, if the retest occurs after the Acceleration Band signal it’s a lower risk entry within a highly probable signal. Adding the Percent Retest filter to your Acceleration bands will help you be patient for those lower risk entries after momentum has confirmed; while Acceleration signals help you identify weaker trends where retest become reversal.
As I’ve mentioned, in general keep a trading system simple – I have found that the unique combination of Acceleration Band breakouts and Williams Percent R re-tests (utilizing Big Trend Percent R methods) is a very effective trading tool & system. I encourage you to start testing this on your favorite stocks as it has helped me increase my winning percentage, while reducing those whipsaws that many traders experience from Acceleration Bands alone.
Trade Well,
Price Headley
BigTrends.com
1-800-244-8736
Back to top
Support Tip
How do I color my volume for up / down colors?
Contributed by Equis Support
Volume is one of the most powerful technical tools traders use in predicting the way a security is about to move. The difference between a smaller return and a bigger return is sometimes only a matter of seconds. Coloring volume bars to identify up volume and down volume can be used as a tool to give traders the edge they need.
To do this we must create a custom indicator in MetaStock.
1. Open MetaStock.
2. From the Tools menu on the main toolbar, select Indicator Builder.
3. Click New on the right hand side to open the Indicator Editor to create the new indicator.
4. Type in the desired name of the indicator in the name section.
5. Check the option to “Display in quicklist”.
6. Click in the larger “Formula” window and type or copy and paste this formula:
When comparing volume data to yesterday’s volume data:
If(V>=ref(V,-1),V,0);
If(VOr when comparing volume data to yesterday’s close price:
If(C>=ref(C,-1),V,0);
If(C7. Click ok to close the Indicator Editor and create the indicator, then close the Indicator Builder dialog.
8. Open any chart.
9. Using the indicator quick list, plot your new volume indicator; this will plot two different lines.
10. Scroll to the end of the chart and right click onto the line going up and select properties. Next select the Color/Style tab and select green for the color and set the style to histogram. Then select OK.
11. Scroll to the end of the chart and right click onto the line going down and select properties. Next select the Color/Style tab and select red for the color and set the style to histogram. Then select OK.
Back to top
MetaStock Features
Big Trends Toolkit Review
Contributed by David Derricott
The Big Trends Toolkit has been an immensely popular add-on. The reason is simple; people have found that the system works. Big Trends Toolkit features Explorations, System Tests, and Expert Advisors. The systems included in the add-on are Price Headley’s time tested strategies and can be used in any market. When market changes happen, as they have in the last year, it is important to have strategies that have proven their merit over time, and this is why the toolkit has been so popular. The Toolkit can be used to identify low-risk entry and exit points, spot accelerations, and more. I would encourage users to use the System Tests included with the Big Trends Toolkit to identify the best system to match the stocks you are trading. Customers really appreciate the level of detail in which the commentaries define how to use the system in trading. Each commentary provides detailed explanations of the systems and detailed instructions on how to trade each entry with your risk tolerance in mind. You have the opportunity to try this add-on on a 30 day money back guarantee.Last edited by tradingpro8x; 18-09-2012 at 08:35 AM.
-
Những thành viên sau đã cám ơn :
ziming (11-12-2013)
-
13-09-2012 09:37 AM #9
- Ngày tham gia
- Oct 2009
- Bài viết
- 1,925
- Được cám ơn 617 lần trong 428 bài gởi
Những series bài hay về phần mềm phân tích kỹ thuật MetaStock
Đây là series những bài nghiên cứu chuyên sâu về phần mềm phân tích kỹ thuật MetaStock
Catch that Trend! Directional Strength and How to Find it.
Contributed by Barbara Star, Ph.D.
Traders usually favor moving averages to help them determine price trend. However two other popular indicators, the Moving Average Convergence/Divergence (MACD) and the Average Directional Index (ADX), can help traders detect not only trend direction, but trend strength as well.
The MACD, created by Gerald Appel, is a momentum indicator that often identifies price direction as it rises and falls above or below its trigger line and its zero line.
The ADX, part of the Directional Movement system developed by Wells Wilder, is designed to detect the strength of price movement. ADX values in the 20 to 30 range indicate mild to moderate trending behavior while values above 30 usually signify a strong trend. A rising ADX indicates that prices are trending, but does not reveal the direction of that trend.
Plot the ADX 14 period indicator above the MACD on the same price chart as shown in Figure 1, and patterns emerge that show both trend strength and trend direction.
Three Patterns
Three distinct, and profitable, patterns frequently appear. These patterns do not detect tops and bottoms, but can help traders confirm a trend. They are especially useful for those traders who prefer shorter-term trades.
Confirming Pattern: The confirming pattern occurs when both the ADX and the MACD rise and fall in unison with price. When the indicators rise together they identify up-trending price movement that presents bullish traders with an opportunity to enter the long side of the trade. The strongest and most ideal trading configuration takes place when the ADX begins to rise and the MACD rises above its trigger line and also above its zero line. The level from which the ADX rises does not matter. In the Confirming pattern, when prices change direction to the downside so do both the ADX and MACD to indicate a loss of momentum and/or a potential trend change.
The Confirming pattern was evident on the daily Allegheny Technology price chart. Both indicators rose in April confirming the price move from the $30 to $40 level. Both indicators declined in May as prices dipped, but rose once more in June when price moved toward $45. The indicators declined in late June to reflect the falling to sideways price action.
Diverging Pattern: The diverging pattern identifies down-trending price movement. Here, the indicators move in opposite directions. The ADX rises to indicate that it has found a trend, but the MACD declines which indicates that the direction of the developing trend is down. Its mirror-image formation makes it an easy pattern to spot visually.
This is a good pattern to follow for traders who are bearish and want to short a stock. It also serves to warn those traders who might wish to enter a long position that they should wait for a more favorable time.
The strongest pattern occurs when the ADX rises while the MACD falls below its trigger line and also below its zero line. Two distinct Diverging patterns appeared on the chart of Abbott Labs in Figure 3 as prices took a nosedive from February to March and again in April.
Converging Pattern: This pattern has an upward bias that comes after a steep decline. The ADX rolls over and begins to decline, signifying that the strength of the trend has weakened. At the same time the MACD, which had been below its zero line, begins heading up to its zero line. Visually, the declining ADX and the rising MACD seem to be converging toward each other. Although this pattern sometimes marks the beginning of a new up trend, more often than not it is a countertrend rally that produces a partial retracement of the price decline.
Figure 4 shows the Converging pattern on a daily chart of Honeywell International. Following the price decline in the February time period that took the stock below the $25 level, price began moving up in March where it was able to retrace much of its loss. The MACD responded to the increase in price by crossing above its trigger line and rising to (and in this case, through) its zero line as the ADX stopped rising and moved down to complete the Converging pattern.
This is an enticing pattern, but often not as profitable as the others because its moves tend to be short-lived and, even though the MACD rises, prices may move sideways instead of upward.
A Trading Example
Traders could have profited from many of the patterns signaled by the ADX-MACD duo on the CH Robinson Worldwide price chart in Figure 5.
Area A marked a decline with a Diverging pattern that was followed by a Converging pattern as price rose in area B. That Converging pattern gave way to a Confirming pattern (Area C) as price continued to rally another ten points. A new Confirming pattern appeared in Area D which reflected the decline that filled a prior price gap before reversing to the upside.
Could you have benefited from any of the four areas identified by the ADX-MACD patterns?
Summary
The patterns displayed by the ADX and MACD combination appear on charts of commodities, indexes, and mutual funds as well as stocks. Not only do the patterns have profit potential, they signal changes in price which can help avoid trading pitfalls. This dynamic duo may be worth adding to your trading arsenal.
About Barbara Star
Barbara Star, Ph.D., (818) 224-4070, is a former vice-president of the Market Analysts of Southern California. She is a frequent contributor to the magazine, Technical of Stocks and Commodities. A former university professor, Dr. Star currently provides individual instruction and consultation to those interested in learning technical . Her e-mail address is star4070@aol.com
Back to top
Support Tip
How to Automatically Load Your MetaStock Charts at Start-up
Contributed by Equis Support
Any trader can tell you that being able to quickly load your workspace makes decision making easier and faster. With the ever changing markets, seconds can mean the difference between making a profit and taking a loss. MetaStock's "Restore workspace on startup" allows users to automatically load a user defined workspace of charts and trading systems when opening MetaStock.
How do I get MetaStock to automatically open my charts?
1. Open MetaStock
2. Select - Tools - Options
3. Select the General tab - check the option "Restore workspace on startup".
4. Click OK to apply the settings.
5. Next open all the charts you would like to open automatically on startup, then select File - Exit to close the MetaStock program.
6. When you re-open the program it will open those charts.
Back to top
MetaStock Features
JBL Risk Manager v7.0
Contributed by Devin Ekberg
As I interview successful traders from all over the world, I have the fortune of learning what works and what doesn't work. Overwhelmingly, successful traders share common principles in their individual strategies even though they trade and invest in different markets around the world. Simply stated, there are four requirements:
Entry Strategy - Education & Experience
Trade Sizing Strategy - Money Management - How many shares to buy.
Exit Strategy - Risk Management - Minimize Loss with a stops or exits.
Profit Taking Strategy - Protecting Profits on the way up, when do I SELL
Unfortunately, the major focus of many technical traders is to create a system of entry and exit rules, and trying to develop discipline to follow them. However, they ignore the critical concept of money risk management, and endanger their long-term survival.
There are many books available on proper risk and trade management, and learning these principles are important for removing emotion and calculating risks. The subject is sometimes a bit difficult to follow and ultimately difficult to put into practice.
The new JBL Risk Manager v7 software from Metastock gives a simple "step-by-step" method of managing your trades. It gives you Automatic Trade/Position Sizing, Initial Stop and Trailing Stop exit price calculations, Multiple Portfolios, Short & Long trades, integrates with your Metastock database, Stock Split Adjustment, Performance: Win/Loss ratios, and Trade Expectancy.
This add-on is very unique among the Metastock add-on and plug-in library. If you are currently trading and not utilizing a money management tool, I strongly encourage you to add this to your to-do list. It will make a huge difference.
-
13-09-2012 03:41 PM #10
- Ngày tham gia
- Oct 2009
- Bài viết
- 1,925
- Được cám ơn 617 lần trong 428 bài gởi
Những series bài hay về phần mềm phân tích kỹ thuật MetaStock
Đây là series những bài nghiên cứu chuyên sâu về phần mềm phân tích kỹ thuật MetaStock
$34 Soybeans...Fantasy or Possibility?
Contributed by Jake Bernstein
If you think that my headline is a clear indication that I have finally lost my marbles then perhaps you may change your mind when you consider this possibility in the context of history. Specifically I refer to the 1970’s experience in the soybean (and many other) markets. Given the confluence of cycles, COT commercials accumulation, central bank massive money printing and timing indicators, I believe that the stage is being set for a 1970’s style commodity price inflation “blow off”. Gold and silver have led the way. While it is likely that gold and silver have not yet made their highs, the odds are growing daily that many if not all of the other commodity markets will make similarly large gains over the next few years. I discussed the details of my expectation in a 2 hour Webinar which you should attend if you have not already done so. It was one of my most detailed Webinars and while I made some stunning forecasts for the next few years I believe that they are reasonable as well as based on facts and not fictions.
Among my forecasts was the realistic possibility that soybean prices could reach the $34 level over the next few years. While producers may rejoice and perhaps even see that this is possible based on fundamentals, many traders will likely consider this forecast to be “off the wall” or just not possible. Before you dismiss my forecast as unrealistic, I urge you to consider the chart below. It shows the 1970’s bull market in soybean futures – a bull market that developed in underlying economic and cyclical conditions that were, if anything, less extreme than what exists today. Now, after reviewing the chart, consider the current chart for soybeans with a similar % increase projection. What do you see?
Now that you have had a look at the soybean bull market of the 1970’s consider the “what if” scenario with regard to the current soybean market. Buy why do so? Here is the logic:
Soybean cycles are long term bullish
Fiat money printing all over the world has made virtually all paper backed currencies unpalatable forcing many professionals and savvy investors into tangible assets
Demand for grains and feeds continues to be strong
Based on the monetary and fiscal policies that have been rushed into place in order to prevent an economic collapse, the odds favor significant commodity price inflation for the next few years and
Precious metals accumulation continues to underscore a flight from paper currency into hard assets. This trend has started to spread to all tangible commodities
If soybean prices repeat their 1970’s experience then the chart below shows what could happen over the next few years. Is it impossible? Before you say that this can’t happen consider all of the “this can’t happen” events of the last 25 years. Now take a look at the chart again. I realize that I’m going out on a limb with my forecast but many of my cyclical forecasts over the years have been correct.
Now add to the mix the fact that Commercials as assessed by the Weekly Commitment of Traders Report using my analytical method (available in the Jake Bernstein MetaStock Plug In) shows strong accumulation of long positions virtually across the board in many of the grain markets. Time will tell If I am right but the confluence of fundamentals and technicals is noteworthy. In light of the recent grain report which resulted in a collapse of grain and soybean prices some of you may not take my forecast seriously. If, however, you see my logic this may be the decline that leads to the buying opportunity of great importance. Would I “catch the falling knife” by entering now? No! I’d wait for my intermediate term timing triggers to turn bullish (also available in the Jake Bernstein MetaStock Plug In).
Back to top
Support Tip
How can I scroll through a MetaStock chart one bar at a time?
Contributed by Equis Support
Metastock Pro & MetaStock EOD: 6.52 – 11
Open the desired chart in MetaStock.
Hold down the "Shift" key on the keyboard.
While you are holding down the "Shift" key, left click once on the right or left arrow of the scroll bar of the open MetaStock chart. This will only move one bar to the left or right.
Back to top
MetaStock Features
Performance Systems Plus
Contributed by Ken Spelman
MetaStock (7.2 or newer) comes with 26 performance trading systems. Now you can complete the package and add fifty-four new performance systems and seventy new explorations. The makers of Performance Systems Plus tested thousands of trading systems on thousands of securities to develop this select group of systems. Performance Systems Plus will have you trading with a higher level of confidence and expertise than you’ve ever had before. It includes state-of-the art performance tools for ten of these systems to create a trading strategy helping take the guesswork out of your trading and maximizing your profits.
Performance Systems Plus is optimized for swing and position trading. It is not designed to be used with day-trading. This is one of our easiest add-ons to use and works well with commodities or stocks from any market worldwide.
With Performance Systems Plus you can:
Run an all-new type of exploration that performs system tests over an entire database of securities to find those securities with the most profit potential.
Generate daily buy and sell signals and alerts.
Run a comparison test to find out which of the fifty-four trading systems works best for your chosen security.
Run a signal exploration on a chosen system to generate a list of stocks with buy and sell signals for that day.
With Performance Systems Plus you get:

Find out why Performance Systems Plus has been one of the top MetaStock add-ons of all time.
-
13-09-2012 04:08 PM #11
- Ngày tham gia
- Oct 2009
- Bài viết
- 1,925
- Được cám ơn 617 lần trong 428 bài gởi
Những series bài hay về phần mềm phân tích kỹ thuật MetaStock
Đây là series những bài nghiên cứu chuyên sâu về phần mềm phân tích kỹ thuật MetaStock
Money Flow Index
Contributed by Steven B. Achelis
Overview
The Money Flow Index ("MFI") is a momentum indicator that measures the strength of money flowing in and out of a security. It is related to the Relative Strength Index, but where the RSI only incorporates prices, the Money Flow Index accounts for volume.
Interpretation
The interpretation of the Money Flow Index is as follows:
Look for divergence between the indicator and the price action. If the price trends higher and the MFI trends lower (or vice versa), a reversal may be imminent.
Look for market tops to occur when the MFI is above 80. Look for market bottoms to occur when the MFI is below 20.
Example
The following chart shows Intel and its 14-day Money Flow Index.

Divergences at points "A" and "B" provided leading indications of the reversals that followed.
Calculation
The Money Flow Index requires a series of calculations. First, the period's Typical Price is calculated.

Next, Money Flow (not the Money Flow Index) is calculated by multiplying the period's Typical Price by the volume.

If today's Typical Price is greater than yesterday's Typical Price, it is considered Positive Money Flow. If today's price is less, it is considered Negative Money Flow. Positive Money Flow is the sum of the Positive Money over the specified number of periods. Negative Money Flow is the sum of the Negative Money over the specified number of periods.
The Money Ratio is then calculated by dividing the Positive Money Flow by the Negative Money Flow.

Finally, the Money Flow Index is calculated using the Money Ratio.
*Excerpt taken from Technical from A to Z by Steven B. Achelis. The Money Flow Index is available in MetaStock 11.
Back to top
Support Tip
How do I set up the MetaStock Enhanced System Tester to use no margin when back testing?
Contributed by Equis Support
For MetaStock versions 8-11
1. Open the Enhanced System Tester.
2. On the left side under "systems", highlight the test you would like to run and select New Simulation then hit Next.
3. Add your list of securities to test and hit Next.
4. In the Perform Trading Simulation screen click the More button.

5. In the Interest Rates section, change the Margin to 0.
6. Under the Margin Requirements section change the options to the settings below:
Long Initial: 100%
Long Maintenance: 0%
Short Initial: 200%
Short Maintenance: 101%

7. Hit OK to save your changes and hit Next to continue through the Enhanced System Tester and start the test.
Back to top
MetaStock Features
Trade Oracle
Contributed by Greg Allred
In the world of trading we need to keep up with the ever-changing markets. Systems that have worked in the past will not necessarily work in the future. With MetaStock, we have the capability of modifying our trading systems but rewriting a system can take time and effort. Luckily, Trade Oracle, an add-on that includes 90 ready-to-use and proven systems, has already done that work for you.
Trade Oracle has been around for a few years but is so robust that it still applies to current market conditions. In order to create Trade Oracle, the developers tested over 10,000 trading systems in order to compile the most powerful library of trading systems. Only those systems that had a greater than 50% success rate were chosen. The industry average for similar products are based on a 25-33% success rate.
In Trade Oracle, 100% of the trading systems are open code. It is very difficult to have confidence in a system you cannot see. All of the systems Trade Oracle includes will allow you to see why a particular system is winning or failing so you can make the changes necessary to build confidence and in the end, have more success.
Trade Oracle quickly shows you the top performing systems for any security. With the Best System indicator, you immediately see the top three performing systems as well as their ability to perform, just by dragging and dropping one indicator. You also have a choice of measurement methods to choose from:
- Best Equity (Points)
- Best Equity (Percent)
- Best Trade Efficiency (Points)
- Best Trade Efficiency (Percent)
Trade Oracle is the program that will help you take your trading to the next level. It will give you the tools necessary to stay ahead of the markets and be a more successful trader.
-
15-09-2012 08:58 AM #12
- Ngày tham gia
- Oct 2009
- Bài viết
- 1,925
- Được cám ơn 617 lần trong 428 bài gởi
Những series bài hay về phần mềm phân tích kỹ thuật MetaStock
Phân tích kỹ thuật Metastock - Cài đặt và các ứng dụng cơ bản
Metastock là một phần mềm phân tích kỹ thuật khá phổ biến. Ngoài việc cung cấp công cụ phân tích kỹ thuật thông qua các biểu đồ, chỉ số v.v, Metastock cho phép người sử dụng kết nối dữ liệu Online, thực hiện lệnh mua và bán chứng khoán tự động (nếu công ty môi giới có hạ tầng kỹ thuật cho phép điều này) và nhiều chức năng khác. Tại thị trường VIệt Nam, Vietstock là đối tác chính thức phân phối phần mềm này và cũng là một trong những tổ chức đi đầu trong việc giảng dạy, quảng bá, cung cấp dữ liệu cho các phần mềm phân tích kỹ thuật nói chung và cho MetaStock nói riêng.
Nhiều phần mềm phân tích chứng khoán khác cũng rất phổ biến và có những tính năng riêng, ví dụ thực hiện marketing scanning (lọc ra một số chứng khoán đáp ứng tiêu chí nhất định), đưa ra một vài loại biểu đồ “độc quyền”. Ngược lại, lợi thế của Metastock là giao diện đơn giản, dễ sử dụng, phù hợp với mọi thị trường, và đặc biệt có công cụ Metastock Formula Language (một dạng như công thức của Excel), cho phép tạo ra những tính năng cao cấp tuỳ nhu cầu của người sử dụng. Chính vì thế có rất nhiều những sản phẩm được tạo ra để gắn vào Metastock (gọi là plug-ins), ví dụ các công cụ phân tích của các công ty như Profitunity, PS, Robert Deel v.v. Nói chung là Metastock phù hợp với mọi trình độ phân tích kỹ thuật và có mức giá khá hợp lý.
Phần 1: Cài đặt: Cài đặt phiên bản MS Professional 10.1 (có thể mua đĩa ở ngoài) là phù hợp đối với thị trường Việt Nam rồi, không nhất thiết phải download phiên bản mới hơn (11.0) cho mất công vì bản mới này hay bị lỗi khi các chuyên viên phân tích kỹ thuật sử dụng với cường độ cao.
Link download phần mềm Metastock 10.1: http://www.mediafire.com/?1k4crkxd2gl
Phần 2: Sau khi cài đặt: The Downloader dùng để xử lý data (tải, nhập, chỉnh sửa, copy, xoá, sắp xếp v.v), còn Metastock Professional dùng để thực hiện phân tích kỹ thuật trên dữ liệu của The Downloader.
Giao diện và cách sử dụng: Nếu ai đã từng sử dụng MS Word, MS Excel hoặc Powerpoint sẽ thấy sự tương đồng giữa hai ứng dụng trên đây và Metastock. Metastock và The Downloader nút shortcut tương tự (về hình dạng và chức năng) như các phần mềm Office, như New, Open, Save, Print, Undo, Redo v.v. Ngoài ra có những nút khác của riêng Metastock mà tôi sẽ nói kỹ hơn ở phần sau.
Đặc biệt, Metastock cho phép các thao tác: double-click (kích đúp chuột), righ-click (kích chuột phải), drag-and-drop (kích và rê chuột), context sensitive help (trợ giúp tuỳ theo từng tình huống) hoàn toàn tương tự như khi sử dụng Word, Excel hay Powerpoint, vì thế khi các bạn lúng túng với một chức năng hay object nào đó, chỉ cần nhớ right-click, double-click hoặc click vào biểu tượng Help hoặc dấu hỏi bên cạnh mũi tên là có câu trả lời.
Phần 3: Dữ liệu sử dụng cho Metastock
Trước khi đi sâu tìm hiểu cách sử dụng Metastock, tôi sẽ nói sơ qua về dữ liệu sử dụng để phân tích bằng Metastock. Metastock sử dụng dữ liệu Online (được cung cấp qua Internet, có thể ở dạng Real time nghĩa là ngay lập tức, hoặc có độ trễ nhất định tuỳ nhà cung cấp), hoặc dữ liệu Local (do mình tự load vào máy). Ở đây xin giới hạn đến bối cảnh của TTCK Việt Nam là phải dùng Local data, và nguồn dữ liệu hiện có duy nhất theo tôi biết hiện nay là từ Viéttock Updater (miễn phí dũ liệu chưa điều chỉnh, còn điều chỉnh rồi thì có thu tiền).
Download miễn phí Vietstock Updater tại đây http://share.vn/Updater/VietstockUpd...hFramework.exe
Ngoài ra các hướng dẫn chi tiết cụ thể của MetaStock và AmiBroker khi download và sử dụng thì download ở đây http://share.vn/Updater/VietstockUpd...sion%202.1.pdf
Dữ liệu của Vietstock Updater có dưới dạng file của MetaStock luôn và chứa trong thư mục C:\MetaData
Dữ liệu Date được quy ước theo dạng mm/dd/yyyy (tháng/ngày/năm). Các bạn không cần tạo các dữ liệu bằng tay (giả sử là Excel, ví dụ để xây dựng chỉ số Advance-Decline Line, các bạn phải tự tạo dữ liệu về số lượng chứng khoán giảm giá trong ngày, số lượng chứng khoán tăng giá trong ngày v.v là những dữ liệu không được cung cấp sẵn) vì chúng tôi đã tính sẵn rồi. Tôi không đi sâu vào chi tiết, trong phạm vi của phần này dữ liệu của Vietstock Updater đã phù hợp với mục đích của Metastock rồi.
Về lý thuyết, đối với một file dữ liệu dùng để nhập vào, Metastock chỉ cần 2 trường là Date và Close (nếu nhập dữ liệu vào một chứng khoán đã có sẵn thì không cần Ticker, nếu không có ticker và chưa có chứng khoán thì Metastock tự tạo và hỏi mình đặt tên). Tuy nhiên vì Metastock lưu dữ liệu theo 6 trường (fields): Ticker, Date, Open, High, Low, Close, Volume và Open Interest, nên những trường không có sẽ bị gán giá trị = 0, các bạn nên lưu ý trường hợp này.
Open Interest là một thông tin quan trọng cho phân tích kỹ thuật, tuy nhiên nó liên quan đến Options (quyền mua / quyền bán) vốn chưa có trên TTCK Việt Nam, chứ nó không phải là khối lượng dư mua hay dư bán sau mỗi phiên như một số người lầm tưởng. Vì vậy chúng ta có thể bỏ qua Open Interest.
Lưu ý quan trọng: sau này khi sử dụng tốt Metastock, các bạn cần kiểm tra (Test) dữ liệu. TTCK Việt Nam lấy giá Open là giá Close của hôm trước, với phương thức khớp lệnh theo phiên như hiện nay giá Open có thể không nằm trong khoảng High – Low. Bên cạnh đó BSC thường nhập lộn giá trị của High – Low – Close (nhất là của VNINDEX) nên đôi khi thấy High nhỏ hơn Low, hoặc Close lớn hơn High v.v.
Phần 4: Nhập dữ liệu cho Metastock
Chúng ta đã có ý tưởng sơ qua về loại dữ liệu sử dụng cho Metastock, và chúng ta cũng tạm hài lòng với những gì Vietstock cung cấp.
Các hướng dẫn chi tiết cụ thể của MetaStock và AmiBroker khi download và sử dụng thì download ở đây http://share.vn/Updater/VietstockUpd...sion%202.1.pdf
Phần 5: Tìm hiều các menu của The Downloader
Sau đây tôi trình bày về các menu của The Downloader. Mỗi khi chọn một chức năng nhất định, một cửa sổ sẽ hiện ra, tôi xin không đi chi tiết vào tất cả các nút trong mỗi cửa sổ. Các bạn có thể đặt câu hỏi trong topic này hoặc gặp tôi tại địa chỉ Trà Quán Padme ở bài đầu tiên, tôi sẽ giải thích thêm. Ngoài ra cũng xin nhắc lại là Metastock có chức năng Context Sensitive Help, trong mỗi cửa sổ sẽ có nút Help giải thích chi tiết chức năng của mỗi nút trong từng cửa sổ, các bạn có thể click vào đó để tìm hiểu.
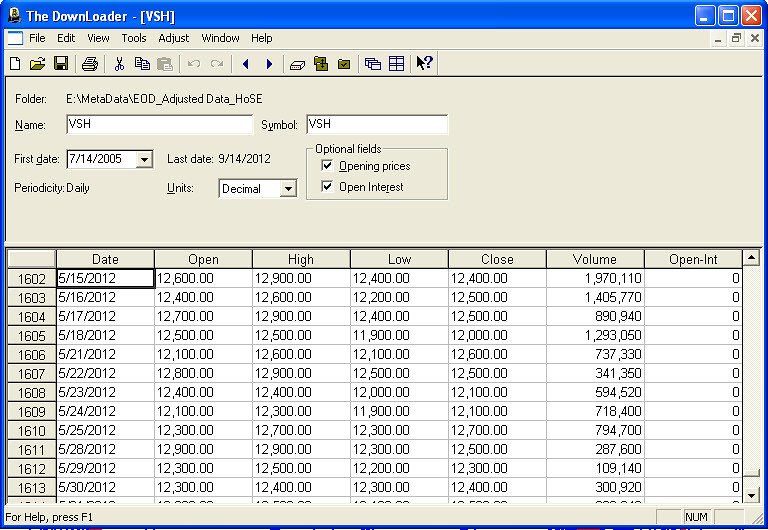
The Downloader / File:
Trong mục File có chức năng New để tạo một chứng khoán mới (chưa có dữ liệu), Open để mở một chứng khoán hiện có, Print để in. Thông thường khi các bạn có dữ liệu, ví dụ của BSC (www.bsc.com.vn ) hoặc dữ liệu các bạn tự tạo qua Excel và chuyển dữ liệu đó thành dữ liệu của Metastock thì các chứng khoán sẽ được tự động tạo ra trong quá trình nhập dữ liệu, vì vậy các bạn không cần quan tâm lắm đến chức năng New.
Trong File / New có hai lựa chọn: Security hoặc Composite. File / New / Security nghĩa là tạo ra một chứng khoán “gốc”, nghĩa là chứng khoán “thật” để nạp dữ liệu của chứng khoán đó vào phân tích. Ví dụ tôi tạo ra chứng khoán GMD và nhập dữ liệu của GMD vào (như tôi nói ở trên, nếu các bạn đã có sẵn data của GMD và trong dữ liệu của GMD có ticker thì khi nhập data của GMD vào Metastock bằng chức năng Convert, chứng khoán GMD sẽ tự động được tạo ra).
File / New / Composite dùng để tạo ra một chứng khoán (đúng ra cứ gọi nó là Composite cho khỏi lộn) bằng cách kết hợp 2 chứng khoán khác thông qua các phép toán cộng, trừ, nhân, chia. Ví dụ: tôi muốn biết GMD tăng trưởng so với toàn bộ thị trường như thế nào, tôi sẽ lấy GMD chia cho VNINDEX và theo dõi hiệu số này qua thời gian. Như vậy tôi sẽ tạo ra một Composite bằng GMD / VNINDEX.
File / New / Open dùng để mở dữ liệu của một chứng khoán. Dữ liệu của chứng khoán trong Metastock như đã nói ở trên gồm có các trường Ticker, Date, Open, High, Low, Close, Volume và Open Interest, và được lưu trữ dưới dạng datasheet (một dạng như bảng tính Excel).
Trong Downloader / File , mỗi khi mở dữ liệu một chứng khoán dưới dạng datashet sẽ có các chức năng khác như Close, Save, Page Setup, Print v.v cũng tương tự như các phần mềm Office, tôi không đi sâu vào chi tiết.
Bây giờ giả sử các bạn hãy mở dữ liệu của GMD (sau khi đã qua phần convert dữ liệu của BSC thành dữ liệu Metastock mà tôi trình bày ở trên). Chọn File / Open hoặc ấn vào nút Open trên thanh công cụ. Cửa sổ Open sẽ hiện ra, bạn chọn GMD trong danh sách các mã chứng khoán hoặc gõ vào GMD ở ô Security. Lưu ý là nếu convert data của BSC theo cách ở trên và không làm thêm thao tác gì khác thì tên chứng khoán (Name) và mã chứng khoán (Symbol) là giống nhau, ví dụ đều là GMD – GMD chứ không phải là Gemadpet – GMD. Click vào Open và datasheet của GMD sẽ hiện ra.
Phần 6: Tìm hiều các menu của The Downloader (tiếp)
Chào mừng các bạn trở lại. Chúng ta đã mở datasheet của GMD. Phần trên của datasheet là các thông tin chung về chứng khoán GMD, các bạn có thể đổi symbol, đổi tên, nhập lại First date là ngày tương ứng với record đầu tiên, chỉnh lại đơn vị tính, có các cột Open và Open Interest hay không. Sau khi các bạn sửa những thông tin đó thì datasheet sẽ được tự động thay đổi theo. Để lưu lại những thay đổi các bạn có thể nhấn Ctrl + S, hoặc vào File / Save, hoặc click vào biểu tượng Save trên thanh công cụ. Nếu không làm vậy, khi đóng datasheet lại, Downloader cũng sẽ có câu hỏi có lưu lại những thay đổi không.
Downloader / Edit
Phần dưới của datasheet tương tự như bảng tính Excel, trong đó có các cột là các trường (fields), có các ô (cells), mỗi hàng là một record tương ứng với một ngày. Trong menu Edit có các chức năng cho phép xử lý các cells nhưl: Cut, Copy, Paste, Clear. Ngoài ra có chức năng tìm ngày (Find date), ví dụ sau này các bạn Test dữ liệu và thấy trong quá khứ có những record bị lỗi, cần sửa lại thì sẽ dùng chức năng Find date để tìm record đó; chức năng chèn thêm dòng (insert row), xoá dòng (delete row). Tất cả các chức năng trong menu Edit thao tác hoàn toàn giống như Excel, kể cả phím tắt cũng tương tự (Ctrl + C là copy, Ctrl + X là Cut, Ctrl + V là paste v.v).
Khi các bạn di chuyển con trỏ trong các cells của datasheet, nếu một record có lỗi thì sẽ bị báo lỗi, ví dụ VNINDEX thường xuyên bị báo lỗi “The High-Low-Close relationship for <date> is unusual. Do you want to edit this record?”. Lý do như đã nói, có thể do nhập lộn giá trị của High và Low.
Downloader / View
Trong menu View không có gì đặc biệt. “Last Conversion Report” dùng để xem kết quả của lần convert data cuối cùng (bài trước đã nói kỹ về converson report).
Downloader / Tools
Đây là menu quan trọng nhất cho việc xử lý dữ liệu của Downloader. Chúng ta đã biết chức năng Convert (các bạn muốn tìm hiểu cách convert các dạng file khác có thể đọc thêm trong phần Help, giải thích khá chi tiết, hoặc trao đổi thêm với tôi). Sau đây tôi sẽ nói về chức năng Test, và các chức năng khác.
Chức năng Test cũng khá đơn giản. Các bạn chọn Tools / Test hoặc click vào incon Test trên thanh công cụ (biểu tượng một hình chữ nhật có dấu tick). Cửa sổ Test Securities sẽ hiện ra. Nút Browse để bạn vào thư mục nơi chứa các file data Metastock. Bạn chọn các Securities để test xem dữ liệu có vấn đề không. Để chọn toàn bộ các Securities có thể chọn 1 security bất kỳ, sau đó nhấn Ctrl+A (y chang Word hay Excel!). Để chọn 1 loạt securities liền nhau, sử dụng phím Shift + mũi tên. Để chọn 1 số securities riêng lẻ, nhấn giữ Ctrl trong khi chọn. Trước khi Test, các bạn hãy vào Options. Trong cửa sổ Options sẽ có một số lựa chọn: Các loại lỗi nào bạn muốn kiểm tra xem dữ liệu bị lỗi. Có thể chọn tất cả các loại lỗi, tuy vậy vì thị trường CKVN giao dịch theo phiên, lấy giá Close hôm trước làm giá Open hôm sau nên hay bị lỗi 1100 “Open outside of High-Low range”, đây là một lỗi đối với Metastock nhưng không phải là một lỗi đối với TTCKVN nên cần bỏ chọn lỗi 1100 – nếu không số lượng lỗi báo quá nhiều, khó theo dõi và khi số lỗi vượt qua ngưỡng Maximum errors mà mình đặt ở dưới thì sẽ ngưng lại, các lỗi sau đó không được report.
Bên dưới, chọn Show securities with errors only, không chọn Strict test, đặt Maximum errors khoảng 3000 chẳng hạn. Sau đó OK và quay trở lại cửa sổ Test Securities. Nhấn Test để thực hiện việc kiểm tra dữ liệu, sau đó Test Report sẽ hiện ra báo cho các bạn biết mỗi chứng khoán bị những lỗi gì.
Kinh nghiệm của tôi là lỗi bị nhiều ở VNINDEX, và bị ở cả những record gần nhất nên phải được sửa lại. Còn các chứng khoán khác bị nhiều ở những records của các năm trước nên bỏ qua cũng không sao (trừ khi bạn muốn chạy backtesting một trading system nào đó và cần sử dụng dữ liệu của toàn bộ quá khứ).
Phần 7: Tìm hiều các menu của The Downloader (tiếp)
Tools / Adjust : chức năng này dùng để điều chỉnh dữ liệu (chỉnh ngày Start lui về trước để bổ sung thêm dữ liệu quá khứ, chỉnh dữ liệu của một chứng khoán bằng cách cộng trừ nhân chia với một giá trị nào đó, chỉnh Start / End time của dữ liệu trong ngày – intraday data). Trong phạm vi của bài viết này tôi không đi sâu vào chi tiết vì không cần thiết.
Tools / Copy, Delete : khác với các lệnh Copy / Delete trong menu Edit dùng để copy hoặc delete dữ liệu của các cells hoặc các records trong một datasheet của một chứng khoán nào đó đang được mở, các lệnh Copy / Delete trong menu Tools dùng để copy toàn bộ một file dữ liệu của một chứng khoán (từ folder này qua folder khác hoặc trong cùng một folder), delete (xoá) một chứng khoán hoặc xoá toàn bộ data của một chứng khoán.
Tools / Merge : chức năng này dùng để gộp dữ liệu của 2 chứng khoán (lưu ý là dữ liệu của mỗi chứng khoán đều được tổ chức dưới dạng datasheet với 7 cột: Date, Open, High, Low, Close, Volume, Open Interest, các records được phân biệt với nhau bởi giá trị Date). Sử dụng chức năng này ví dụ khi data của cùng một loại chứng khoán được chứa ở 2 file khác nhau, file thứ nhất chứa data từ 2000 đến 2003, file thứ hai từ 2003 đến nay. Khi đó thực hiện thao tác merge dữ liệu từ file nguồn (file 1) qua file đích (file 2) để có được một file đầy đủ dữ liệu từ 2000 đến nay. Sử dụng file nào làm file nguồn, file nào làm file đích cũng được. Chức năng này ít dùng nên tôi cũng không đi vào chi tiết.
Tools / Sort : chức năng này dùng để sắp xếp dữ liệu của một chứng khoán (Sort Data) theo trình tự tăng giảm dần về thời gian và loại bỏ những records trùng trong datassheet của chứng khoán đó, hoặc sắp xếp thứ tự lưu và xuất hiện các file chứng khoán theo thứ tự abc (Sort Securities). Thông thường các chứng khoán mới nhất sẽ đứng ở cuối danh sách, chứng khoán lâu nhất đứng ở đầu (đây là cách sắp xếp ngầm định theo Start Date của Metastock).Last edited by tigeran; 15-09-2012 at 10:15 AM.
-
15-09-2012 09:02 AM #13
- Ngày tham gia
- Oct 2009
- Bài viết
- 1,925
- Được cám ơn 617 lần trong 428 bài gởi
Những series bài hay về phần mềm phân tích kỹ thuật MetaStock
Phân tích kỹ thuật Metastock - Những ứng dụng nâng cao
Hướng dẫn sử dụng qua video phần mềm cung cấp dữ liệu cho MetaStock và AmiBroker
Cài đặt phần mềm VietstockUpdater2.1
http://share.vn/updater/hdsd/Cai%20d...r_06122011.htm
Đăng nhập, thiết lập dịch vụ
http://share.vn/updater/hdsd/Login,%...u_06122011.htm
Giới thiệu các gói dữ liệu
http://share.vn/updater/hdsd/Gioi%20...u_06122011.htm
Cập nhật dữ liệu
http://share.vn/updater/hdsd/Cap%20n...u_06122011.htm
Phần 8: Tìm hiểu giao diện của Metastock
Các phần trước tôi đã nói sơ về việc sử dụng The Downloader và các thao tác trên dữ liệu. Ngoài những chức năng đã đề cập, khi mở datasheet của một chứng khoán, trên hàng menu sẽ có thêm menu Adjust (không phải chức năng Adjust trong menu Tools) sử dụng để điều chỉnh dữ liệu khi có các nghiệp vụ tách, gộp cổ phiếu. Tuy nhiên, quan trọng nhất trong The Downloader vẫn là 2 chức năng Convert và Test trong menu Tools mà các bạn mới tìm hiểu nên nắm rõ. Ngoài ra, các bạn cũng đừng quên chức năng Context Sensitive Help của The Downloader.
Bây giờ các bạn có thể mở Metastock (offline mode). Giả sử các bạn cài đặt bình thường và chưa có bất kỳ thay đổi nào đối với giao diện Metastock, thì màn hình Metastock sẽ có những phần sau đây (khi chưa mở chart của bất kỳ chứng khoán nào).
Bên dưới hàng Menu (File, View, Tool, Help) đầu tiên là thanh công cụ chuẩn (Standard Toolbar) gồm có lần lượt các nút: New, Open, Save, Print, Print Preview, Copy, Paste, Undo (Redo) với hình dáng và chức năng hoàn toàn giống như các nút tương tự của các phần mềm Office. Tiếp theo cũng trong Standard Toolbar còn có các nút lần lượt từ trái qua phải như sau:
Data Window : khi chọn nút này sẽ hiện lên một cửa sổ có dữ liệu tương ứng với các điểm trên đồ thị đang mở trên màn hình, tuỳ theo vị trí của con trỏ.
Zoom box : dùng để phóng lớn một đoạn biểu đồ nào đó. Để sử dụng nút này, các bạn hãy nhớ thao tác drag-and-drop mà tôi nhấn mạnh ở những bài đầu tiên. Click vào biểu tượng Zoom box, sau đó chọn vị trí trên biểu đồ, giữ và rê chuột. Để quay trở về trạng thái như cũ, chúng ta sử dụng nút Zoom Reset ở góc phải phía dưới màn hình mà tôi sẽ nói ở dưới đây.
Cạnh nút Zoom box là Indicator QuickList: nơi đây có tất cả các chỉ số (indicator) của Metastock cũng như các chỉ số plug-in (do các công ty tạo ra gắn kèm với Metastock), hoặc chỉ số customized do người sử dụng tự tạo ra. Để vẽ biểu đồ cho một chỉ số, có thể sử dụng chức năng Tool / Insert, hoặc chọn chỉ số trong Indicator QuickList, giữ và rê chuột đến nơi định vẽ biểu đồ cho chỉ số đó (thao tác drag-and-drop mà tôi đã nói ở trên). Tất nhiên còn nhiều chi tiết khác khi vẽ biểu đồ cho chỉ số (plotting an indicator) mà tôi sẽ nói kỹ hơn sau, ví dụ như xây dựng chỉ số cho cái gì, cho chứng khoán (base security) hay chỉ số của một chỉ số khác v.v.
Kế bên Indicator QuickList là một loạt các chức năng quan trọng và tương đối cao cấp của Metastock, để hiểu các chức năng này cần có kiến thức về Metastock Formula Language (tôi sẽ dần dần trình bày sau). Các chức năng này gồm:
The Downloader : đã nói ở phần trước
Expert Advisor : đưa ra những phân tích, nhận định cho từng biểu đồ (ví dụ bạn vẽ đường MACD, nếu bật chức năng Expert Advisor của MACD thì màn hình sẽ hiện ra những vùng xanh đỏ, vùng xanh là ám chỉ MACD đang bullish (xu hướng tăng giá), vùng đỏ là bearish (xu hướng giảm giá), cung cấp commentary (MACD hiện tại đang ra sao), khi có một signal (dấu hiệu mua hoặc bán) thì thông báo có thể hiện lên màn hình hoặc gửi đến email (tất nhiên mọi người sử dụng bản crack thì không thể thực hiện chức năng này) v.v
Indicator Builder : cho phép xây dựng các chỉ số tuỳ theo cách phân tích của người sử dụng. Ví dụ chỉ số MACD sử dụng trong Metastock được xây dựng từ 2 đường trung bình trượt với những trọng số nhất định gán cho 2 đường (phương pháp exponential), người sử dụng có thể tự tạo ra chỉ số MACD từ hai đường trung bình trượt do mình quy định, ví dụ 12-day và 26-day simple moving averages. Tuy nhiên số lượng các chỉ số có sẵn trong Metastock cũng tương đối đủ dùng rồi.
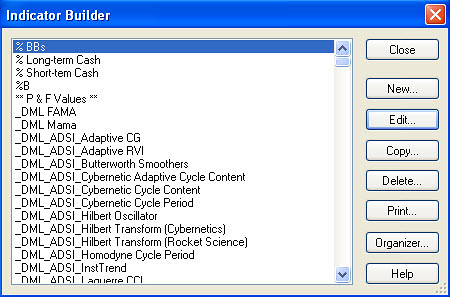
OptionScope : dùng để phân tích các hợp đồng quyền mua/ quyền bán (options) hoặc hợp đồng kỳ hạn (futures), hiện chưa có ở thị trường CKVN.
Enhanced System Tester : cho phép thiết lập các trading systems theo phương pháp PTKT thuần tuý. Ví dụ thay vì bạn phân tích và mua/ bán chứng khoán GMD tuỳ theo tình hình thị trường mà bạn theo dõi hàng ngày, bạn sẽ thiết lập một hệ thống tự động mua (hoặc cung cấp dấu hiệu mua – buy signal) mỗi khi đường MACD của GMD từ dưới vượt lên trên đường trung bình trượt 9 ngày của nó (trigger line), và tự động bán (hoặc cung cấp dấu hiệu bán – sell signal) khi nó đi từ trên xuống dưới qua đường trigger line. Ngoài ra, có thể sử dụng chức năng này để kiểm chứng xem một chỉ số mình sử dụng đã được thiết lập phù hợp chưa, ví dụ bạn băn khoăn không biết nên sử dụng đường MA 20 ngày hay 30 ngày, có thể backtesting một mô hình trading dựa trên đường MA 20 ngày, và một mô hình dựa trên đường MA 30 ngày. Mô hình nào tốt hơn sẽ cho câu trả lời nên lựa chọn 20 ngày hay 30 ngày.
The Explorer : đây là chức năng cho phép lọc ra các chứng khoán đáp ứng những tiêu chuẩn nào đó và cung cấp các chứng khoán đó theo một danh sách, kèm thêm một số giá trị mình chọn. Ví dụ: cứ cuối tuần, bạn lọc ra các chứng khoán tăng giá trong 3 ngày liên tiếp, hiện các chứng khoán này thành một danh sách trong đó có các cột tên CK, mức giá trong từng ngày, thay đổi về giá v.v.
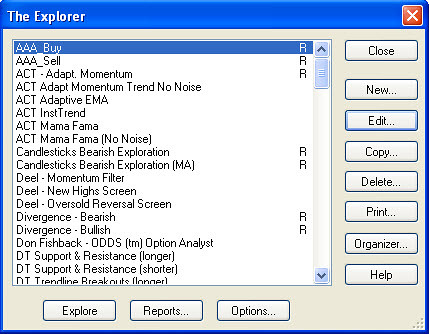
Các nút khác có trên thanh Standard Toolbar là Metastock Community (chỉ có ở phiên bản cao hơn 8.0) để kết nối với các website/ forum liên quan đến Metastock, và nút Context Sensitive Help (hình mũi tên+dấu hỏi). Khi bạn không hiểu một biểu tượng trên màn hình có ý nghĩa gì, chỉ việc click vào nút Context Sensitive Help, và click vào biểu tượng muốn tìm hiểu.
Sau đây là sơ lược về các toolbar khác:
Kế bên Standard Toolbar (cạnh biểu tượng Context Sensitive Help) là Window toolbar, cho phép sắp xếp các cửa sổ khi có nhiều cửa sổ cùng mở một lúc trên màn hình.
Dòng dưới cùng sát đáy màn hình có các toolbars: Style, dùng để định dạng biểu đồ các đường chỉ số (như dạng đồ thị, nếu là line thì vẽ nét liền hay nét rời v.v), độ dày của các đường (thickness). Color, dùng để đặt màu cho các biểu đồ. Để áp dụng Style hoặc Color, chỉ cần click trên đối tượng muốn định dạng, sau đó click trên style hoặc color mong muốn.
Tiếp theo là Custom Toolbar, có các biểu tượng Internet browser để truy cập các trang web của Equis (công ty tạo ra Metastock), các nút Apply Clean Template và Apply Popular Template, dùng để tạo thêm 1 biểu đồ của chứng khoán đang mở trên màn hình (gọi là “base security”), biểu đồ mới được tạo ra sẽ ở dạng Clean Template hoặc Popular Template. Các bạn sử dụng phần mềm Office cũng biết template là một định dạng có sẵn, trong Metastock, mỗi template sẽ có một định dạng về màu sắc, kiểu chart, những chỉ số nào được trình bày cùng với biểu đồ giá v.v. Clean Template chỉ thuần tuý có đường biểu diễn giá của chứng khoán (dưới dạng bar), còn Popular Template ngoài đường giá theo dạng bar còn có các chỉ số RSI, Stochastic, MACD và Volume.
Kế tiếp là các biểu tượng mà khi click vào đó, màn hình sẽ trình bày Broad Layout của thị trường tiền tệ, NASDAQ và NYSE (có thể các phiên bản thấp không có những layout này). Layout hiểu nôm na là một hình thức trình bày các chart trên một màn hình, một layout có thể chứa nhiều chứng khoán (khác với template là cách triển khai biểu đồ cho 1 chứng khoán nhất định). Broad Layout cho phép có những thông tin bao quát nhất về thị trường. Ngoài ra thuật ngữ layout cũng được sử dụng để chỉ định dạng in ấn.
Kế bên Custom Toolbar là Trading Toolbar với những công cụ thực hiện giao dịch trực tuyến, tôi không đi sâu vào chi tiết.
Bên phải hoặc bên trái của màn hình sẽ có các toolbar khác: Trendline, có các đường kẻ dọc, kẻ ngang, kẻ chéo để vẽ trendline. Để sử dụng các đường này, hãy nhớ nguyên tắc click-and-drop hoặc drag-and-drop. Các toolbars Line Studies, Gann, Regression, Data, Text v.v tương đối dễ thao tác, tuy nhiên việc sử dụng phụ thuộc nhiều vào kiến thức phân tích kỹ thuật nên tôi không đi vào chi tiết.
Cuối cùng, khi một biểu đồ đang được mở trên màn hình thì ngoài những toolbars ở trên, bên dưới góc phải, phía trên Trading toolbars là một số nút khác rất tiện lợi (chỉ xuất hiện khi có chart đang mở), đó là các nút sau (theo thứ tự từ trái qua):
Refresh Data, ví dụ khi các bạn sử dụng online data (dữ liệu truyền qua mạng nhưng không phải real time), click vào đây để cập nhật dữ liệu mới nhất về (nó giống như thao tác khi soạn văn bản trong Word cứ vài phút lại nhấn Ctrl+Save để lưu vậy).
Periodicity : dùng để thay đổi đơn vị thời gian (periods) để biểu diễn dữ liệu trên biểu đồ (vd dữ liệu ngày chuyển thành dữ liệu tuần, dữ liệu tuần chuyển thành dữ liệu tháng). Quy định về dữ liệu thì các bạn biết rồi, Open là giá close cuối cùng của period trước, close là giá cuối cùng củ period này v.v Vì thế nếu dữ liệu ngày chuyển thành tuần thì Open là giá close của thứ 6 tuần trước, close là giá close của thứ 6 tuần này. Để thay đổi periodicity, click vào biểu tượng và chọn tương ứng. Nếu không sử dụng các periods có sẵn (ngày / tháng / năm) mà tính period theo cách riêng, ví dụ cứ 10 ngày thì tính là 1 period, thì chọn Other và chọn con số mình muốn. Cách khác để thay đổi Periodicity là right click vào trục X (trục ngang), chọn Periodicity hoặc X-axis properties (hãy nhớ nguyên tắc right click).
Kế tiếp là nút Rescale Y axix, sử dụng khi chúng ta có một số thay đổi về đơn vị trên trục tung (trục đứng) như là để maximum value quá cao, và cần điều chỉnh lại. Click vào nút này sẽ tự động chuyển trục tung về thang đo hợp lý sao cho biểu đồ trông vừa vặn.
Nút Zoom Reset, Zoom In hay Zoom Out sẽ thay đổi view của biểu đồ, biểu thị toàn bộ data để mình thấy rõ xu hướng, hay chỉ biểu thị một vài ngày gần nhất để nhìn candlesticks cho rõ hơn.
Kế đến là các nút mũi tên tới, lui dùng để di chuyển qua các chứng khoán tiếp theo (theo trình tự alphabet). Trong một bài trước tôi đã lưu ý các bạn là khi Convert dữ liệu thì nên chọn Traverse Source Folder và bỏ chọn Traverse Destination Folder, như vậy các file dữ liệu sẽ nằm trong cùng 1 folder, và sử dụng các nút này bạn có thể duyệt qua tất cả các chứng khoán.
Cuối cùng là nút Choose Security, click vào đây sẽ hiện ra cửa sổ chứa danh sách các chứng khoán xếp theo alphabet. Các bạn có thể chọn 1 chứng khoán bất kỳ để xem chart của nó. Tuy nhiên có một cách khác để chuyển qua một chứng khoán khác, đó là các bạn cứ gõ vào bàn phím ký tự đầu tiên liên quan đến tên (hoặc mã) chứng khoán, cửa sổ Choose Security cũng sẽ tự động hiện ra. Lưu ý các tính năng này chỉ có khi đang có ít nhất một chứng khoán đang được mở trên màn hình.
Lưu ý quan trọng : trong cửa sổ Choose Security có Options, trong đó có 2 tuỳ chọn là Use Smartcharts và Use chart as template. Tôi sẽ giải thích về smartchart sau, tuy nhiên nếu chọn Use Smartcharts thì chứng khoán bạn chọn sẽ được mở ra y như lần cuối cùng nó được lưu lại, còn nếu chọn Use chart as template thì chứng khoán bạn chọn sẽ được mở ra y như chứng khoán đang được mở trên màn hình. Tác dụng của việc này là giả sử bạn nghĩ ra một kiểu vẽ chart mà bạn ưa thích và muốn kiểu đó được áp dụng cho tất cả chart của các chứng khoán khác, bạn sẽ làm 2 cách:
Lưu kiểu chart mà bạn nghĩ ra thành một dạng template, sau đó mở chart của chứng khoán khác ra và áp dụng template đó (click chuột phải trên biểu đồ của chứng khoán, chọn Apply template và chọn đúng template bạn muốn).
Hoặc mở sẵn chứng khoán có kiểu chart mà bạn ưng ý, mở Choose Security, chọn Options / Use chart as template, khi đó mỗi chứng khoán tiếp theo được mở ra sẽ được quy luôn về dạng chart của chứng khoán đang mở sẵn. Bạn chỉ việc Ctrl+Save là xong.
Phần 12: Tạo biểu đồ
Hẳn ai cũng muốn tôi phải nói ngay vào phần này, vì ai mà không muốn “ra sản phẩm” liền để còn coi ngó xem chứng khoán đang tăng giảm thế nào, đặng còn kiếm chút cháo cho kịp! Tuy nhiên khi các bạn đã sử dụng tương đối tốt Metastock rồi thì sẽ thấy rằng những gì tôi trình bày ở trên, nếu không nhìn từ góc độ đầu tư mà nhìn từ góc độ sử dụng một phần mềm, là rất cần thiết để mình sử dụng sao cho tiện nhất. Ngoài ra, tin tôi đi, cuốn sách dạy Metastock nào cũng nói về Metastock Formula Language và những thứ cao siêu đại loại thế, nhưng không có cuốn nào nói kỹ về dữ liệu và giao diện như “cuốn sách” của tôi đâu.
Có ba dạng biểu thị biểu đồ (tôi cũng không biết phải dùng ngôn ngữ tiếng Việt thế nào để các bạn khỏi lẫn lôn): Smartchart là dạng biểu đồ mà tất cả những gì bạn tạo ra hay chỉnh sửa trên đó đều được lưu lại tức thì (được coi là những chỉnh sửa cuối cùng mà không cần nhấn Ctrl+Save hay chọn Save từ menu File). Smartchart như vậy rất tiện cho chúng ta thao tác. Tuy nhiên mỗi chứng khoán chỉ có 1 smartchart nhưng có thể tạo vô số chart cho chứng khoán đó. Đối với Chart, cần Save và đặt tên thì mới lưu lại được. Giả sử trên màn hình có 2 cửa sổ, một cửa sổ là Smartchart, một cửa sổ là Chart nhưng tất cả những gì được vẽ là y chang nhau, thì để phân biệt ta để ý rằng Smartchart sử dụng tên của chứng khoán (mã CK) làm tên Smartchart, còn Chart thì sẽ có tên bắt đầu bằng Chart1-, Chart2-, v.v trừ khi ta lưu và đặt tên khác. Ngoài Smartchart và Chart, còn có Layout mà tôi đã nói ở bài trước. Smartchart được lưu tại chính folder dùng để chứa dữ liệu của Metastock sau khi convert từ data của BSC.
Để cho tiện, từ đây về sau chúng ta sẽ ngầm hiểu rằng ta đang thao tác trên Smartchart. Thao tác trên Chart hoàn toàn tương tự (nhưng mất công hơn vì phải Save).
Bây giờ hãy mở biểu đồ của một chứng khoán nào đó, giả sử là AGF. Click vào biểu tượng Open trên thanh công cụ hoặc File / Open. Trong cửa sổ Open, phần Files of Type cần chắc chắn là Smartchart.
Nếu bạn chọn một CK trong danh sách và click Open thì Smartchart của AGF sẽ được mở. Smartchart này tương ứng với những thay đổi lần cuối cùng mà bạn áp dụng đối với AGF. Nếu bạn chưa từng mở AGF, thì Smartchart của AGF sẽ tự động được tạo ra theo Default template (tôi đã giải thích template ở bài trước rồi). Nếu bạn muốn mở theo một template khác thì trước hết bôi đen AGF, sau đó cạnh nút Open có một mũi tên nhỏ, click vào đó chọn Open with template, chọn template muốn áp dụng và OK.
Đây là cách mà tôi làm: tôi không quá phức tạp chuyện phân tích kỹ thuật, chỉ cần tạo Smartchart cho mỗi chứng khoán là đủ chứ không cần tạo nhiều Chart để phân tích nhiều góc độ khác nhau. Trong Smartchart, ngoài đường giá, tôi sẽ đưa vào Volume, Bollinger Band, MACD, Stochastic và CMF và chỉ sử dụng những thông số này cho mọi chứng khoán. Do đó tôi sẽ tạo smartchart cho một chứng khoán theo đúng ý mình gồm những thông số trên, và định dạng màu sắc sao cho dễ theo dõi. Sau đó chuyển dạng smartchart này thành default template bằng cách right click trên chart và chọn Save as Default Template. Từ đây về sau, mọi chứng khoán mới được bổ sung vào danh sách, khi lần đầu mở lên sẽ đều có Smartchart như tôi muốn, sẽ tiết kiệm rất nhiều thao tác. Các bạn cũng có thể làm tương tự: xác định cho mình một phương hướng đầu tư dựa trên PTKT, tạo Smartchart phục vụ phương hướng đó, lưu dạng Smartchart đó thành Default template và alê hấp!
Bây giờ giả sử bạn đã mở Smartchart của AGF, bất kể trông nó như thế nào. Bạn hãy click trên biểu đồ (hiện tại đang là đường giá) và chọn style phù hợp (dạng bar hay candlestick, đường liền hay đường không liền nét, dày mỏng cỡ nào nếu là dạng line), chọn color v.v dựa vào các biểu tượng trên thanh công cụ phía dưới mà tôi đã giải thích ở bài trước.
Bạn cũng có thể right click trên biểu đồ, vào phần Properties để chỉnh lại dạng biểu đồ thành Line, Bar, Candlestick v.v tuỳ vào phương pháp PTKT mà bạn theo, chỉnh màu sắc của candlesticks v.v
Bạn cũng có thể chọn biểu đồ, chọn Format / Selected Objects và chỉnh sửa hoàn toàn tương tự như khi sử dụng thanh công cụ hoặc nhấp chuột phải.
Chắc chắn bạn muốn vẽ thêm nhiều thứ khác liên quan đến AGF chứ không chỉ trơ trọi đường giá. Có thể bạn muốn vẽ thêm đường MA trên đường giá, thêm Bollinger Band, thêm Volume v.v, tất cả những cái này sẽ được plot trên cửa sổ hiện tại của đường giá. Để làm điều này rất đơn giản: hãy vào Indicator QuickList, chọn indicator mà bạn muốn (giả sử là Volume, đây không phải là một indicator tuy nhiên vẫn có trong danh sách Indicator QuickList), giữ và rê nó đến cửa sổ của đường giá (price chart). Khi đó biểu đồ đường giá sẽ đổi qua màu khác, bạn thả chuột (drag-and-drop). Một cửa sổ Scaling Options sẽ hiện ra trong đó có 4 lựa chọn: display new scale on left (giá trị của trục tung được biểu diễn bên trái), display new scale on right (giá trị của trục tung được biểu diễn bên phải), merge with scale on left (sử dụng trục tung có sẵn bên trái làm trục giá trị), merge with scale on right (sử dụng trục tung có sẵn bên phải làm trục giá trị), overlay without scale (cứ biểu diễn đồ thị nhưng không cần trục tung). Bạn cần lựa chọn kỹ option nào phù hợp. Vì sao? Trên một cửa sổ có thể bạn muốn biểu diễn rất nhiều thứ, ví dụ: đường giá, volume, MA, Bollinger Band, Relative Performance. Có những thứ cùng đơn vị đo, ví dụ đường giá và đường MA (khi đó nếu đã có đường giá rồi thì đường MA nên sử dụng trục tung có sẵn của đường giá, thường là ở bên phải), có những thứ khác đơn vị như đường Volume và đường giá (khi đó phải chọn trục tung bên trái). Tối đa trên một màn hình chỉ có 2 trục tung ở bên trái hoặc bên phải, nếu đã có đường giá và MA (biểu diễn bên phải), volume (biểu diễn bên trái) rồi thì nếu thêm đường Relative Performance, phải chọn overlay without scale thôi.
Bạn cần để ý đến chi tiết “đường giá sẽ đổi qua màu khác” mà tôi nói ở trên. Khi trong cửa sổ ngoài biểu đồ đường giá còn có biểu đồ đường khác, như Volume hoặc đường trung bình trượt 5 ngày (5-day MA), nếu bạn kéo chỉ số - giả sử chỉ số MA - từ Indicator QuiclList vào cửa sổ đó, biểu đồ nào đổi màu thì chỉ số MA mà bạn đang kéo sẽ là MA của biểu đồ đó. Ví dụ nếu đường giá đổi màu thì bạn đang tạo MA của đường giá, nếu Volume đổi màu thì bạn đang tạo MA của volume, nếu đường 5-day MA đổi màu thì bạn đang tạo MA của một MA. Đường nào đổi màu là do bạn di chuyển con trỏ qua lại trong khu vực của cửa sổ đó. Còn tất nhiên khi trong cửa sổ mới chỉ có một biểu đồ đường giá, thì bạn di chuyển con trỏ cỡ nào cũng chỉ có đường giá đổi màu thôi.
Bây giờ giả sử bạn muốn biểu diễn một chỉ số nhưng ở trong cửa sổ riêng. Trong khu vực của cửa sổ hiện tại, nhấp chuột phải, chọn Inner Window, chọn tiếp New (hoặc vào menu Window, chọn New Inner Window). Bạn sẽ tạo biểu đồ của một chỉ số cũng bằng thao tác drag-and-drop từ Indicator QuickList vào cửa sổ con mới mở. Lưu ý cũng phải để ý khi rê chỉ số từ QuickList vào cửa sổ mới mở, thì ở cửa sổ kia đường nào đổi màu.
Giả sử bạn tạo biểu đồ đường MA trong một cửa sổ riêng mới mở (chưa có gì hết), nhưng ở các cửa sổ khác vừa có đường giá của chứng khoán X, volume của chứng khoán X, đường giá của chứng khoán Y và volume của chứng khoán Y (Y cũng có thể là VNINDEX nếu bạn vừa muốn nhìn biến động của X vừa nhìn biến động của thị trường). Khi đó nếu kéo MA từ Indicator QuickList vào cửa sổ con mới mở, thì đó sẽ là MA của cái gì (giá hay volume, X hay Y?). Lúc đó bạn để ý cái gì đổi màu thì là MA của cái đó. Nguyên tắc chung là dù trên màn hình có nhiều chứng khoán, nhiều đường, nhưng có một chứng khoán chính – gọi là base security – đó là chứng khoán mà bạn mở biểu đồ theo thao tác Open. Các biểu đồ của chứng khoán khác bạn mở sau đó nếu cũng trong cùng màn hình, thì bạn phải mở bằng cách chọn menu Insert / Security. Khi bạn không chỉ định MA của cái gì thì ngầm định sẽ là MA của giá Close của chứng khoán gốc – base security. Nếu bạn muốn minh hoạ MA của cái khác thì phải rê MA từ Indicator QuickList đến trên biểu đồ của cái đó. Sau khi đường MA đó hình thành rồi thì kéo nó đi chỗ nào cũng được. Tuy nhiên còn cách khác nữa là tạo một Customized Indicator, sử dụng cái gọi là “the “P” data array identifier”, nếu ai biết Metastock Formula Language sẽ biết dùng.
Quay trở lại việc tạo biểu đồ cho một chỉ số, thay vì drag-and-drop bằng cách chọn chỉ số từ Indicator QuickList, có thể làm cách khác sử dụng menu: vào Insert / Security. Cửa sổ Indicators sẽ hiện ra, bên trái là danh sách các indicators, giả sử bạn chọn Moving Average. Bên phải là danh sách inner window để biểu thị indicator MA đó. Có thể chọn “new inner window” để tạo một inner window mới để biểu thị đường MA, hoặc chọn một Inner Window đang có (#1, #2 v.v). Trong inner window đang có, nếu có sẵn đường giá (biểu thị bằng mã chứng khoán) và các chỉ số khác, chọn cái nào thì sẽ biểu thị MA của cái đó.
Đến đây các bạn đã có thể tạo biểu đồ theo ý mình. Các bạn có thể thực hành mở 4 cửa sổ, trong cửa sổ thứ nhất có đường giá, hãy bổ sung thêm volume và bollinger band. Ở 3 cửa sổ còn lại, hãy tạo biểu đồ cho RSI, MACD và OBV hoặc bất cứ cách kết hợp chỉ số nào theo gu của bạn. Trong quá trình thao tác, sẽ có những tuỳ chọn mà bạn phải chọn để xác định thông số cho từng indicators. Ngoài ra bạn cũng sẽ format màu nền cho từng cửa sổ (bằng cách click chuột phải, chọn Properties), format màu cho các đường đồ thị, có thể bỏ title của các cửa sổ con cho thoáng màn hình (click chuột phải – inner window – properties – bỏ chọn show title bar) v.v. Các bạn cũng nghiên cứu tất cả các chi tiết nhỏ trong quá trình vẽ biểu đồ (horizontal line, parameters v.v). Xong xuôi rồi, hãy click chuột phải để Save as default template. Từ đây về sau, mọi chứng khoán bạn mở ra theo Smartchart sẽ được tự động tạo biểu đồ theo cách bạn ưa thích.Last edited by tigeran; 15-09-2012 at 10:01 AM.
-
15-09-2012 05:44 PM #14
- Ngày tham gia
- Oct 2009
- Bài viết
- 1,925
- Được cám ơn 617 lần trong 428 bài gởi
Những series bài hay về phần mềm phân tích kỹ thuật MetaStock
Đây là series những bài nghiên cứu chuyên sâu về phần mềm phân tích kỹ thuật MetaStock
Trend Following
Contributed by Michael W. Covel
Answer the following five questions below and you have the core components of a trend following trading system:
1. How does the system determine what market to buy or sell at any time?
2. How does the system determine how much of a market to buy or sell at any time?
3. How does the system determine when you buy or sell a market?
4. How does the system determine when you get out of a losing position?
5. How does the system determine when you get out of a winning position?
Although these five questions are seminal to trend following, no less critical is your attitude. Don't forget to ask yourself: What do you really want? Why are you trading? What are your strengths and weaknesses? Do you have any emotional issues? How disciplined are you? Are you easily convinced? How confident are you in yourself? How confident are you in your system? How much risk can you handle?
Let's jump into a few of those questions.
When do trend followers enter?
After a trend has begun. Why? Trend followers have no ability to predict when a trend will start. The only way to know a trend has started is when it starts to move either up or down. For example, let's say Apple is trading between $200 and $220 for six months. All of a sudden Apple jumps, or breaks out, to a price level of $230. That type of upward movement from a range is a trigger for trend followers. They say, "I might not know that Apple is going to continue upward, but it's been going sideways for a while, and all of a sudden, the price has jumped to $230. I'm not in this game to try and find bargains or cheap places to buy. I'm in this game to follow trends, and the trend is up."
This approach is counter-intuitive for many. One trend trader outlined the simplicity:
"As our systems are designed to send a buy or sell signal only when a clear trend develops. By definition, we never get in at the beginning of a trend or get out at the top."
If your goal is to ride a trend that starts at $50 and perhaps goes to $100, does it really make a difference whether you got in at $52 or $60 or $70? Even if you got in at $70 and the trend went to $100, you still made a lot, right? Of course if you got in at $52 (and how you think you might predict the bottom, I will never know), you made more money than if you got in at $70. There are plenty of traders out there who think, "Oh, I couldn't get in at $52, so I don't get in at all, even if I have the chance to get in at $70."
Famed trader Richard Dennis elaborates:
"Anytime the market goes up a reasonable amount, say a strong day's work - after you've put on a position, it's probably worth adding to that position. I wouldn't want to wait for a retracement. That is everyone's favorite technique - to buy something strong that retraces. I don't see any justification in the statistics for that. When beans are at $8.00 and go to $9.00, if the choice is to buy them at $9.00 or buy them if they retrace to $8.80, I'd rather buy them at $9.00. They may never retrace to $8.80. Statistics would show that you make more money buying them and not waiting for a retracement."
Even if people are familiar with Dennis' approach to trading, they still focus on entry - a misdirection of energy and focus. Another great trend trader dead-panned:
"The entry is a big concern before it happens, a small concern thereafter."
He is saying after you are in a trade, the entry price isn't important. You have no idea how high the market is going to go, right? You should be concerned about protecting your downside in case the market goes against you as opposed to creating dramas associated with entry. How long can trend following trades last? Another trend trader opined:
"Positions held for two to four months are not unusual, and some have been held for more than one year, says a spokesman. Historically, only 30-40 percent of trades have been profitable."
The words of great baseball player Ted Williams immediately come to mind: "Hitting a baseball, I've said it a thousand times, is the single most difficult thing to do in sport. If Joe Montana or Dan Marino completed 3 of every 10 passes they attempted, they would be ex-professional quarterbacks. If Larry Bird or Magic Johnson made 3 of every 10 shots they took, their coaches would take the basketball away from them."
However analogous it is to baseball, only 40 percent winners is hardly a percentage worth most people would think wise to emulate. So how is it possible to make money with 40 percent of your trades winners? Jim Little of trend follower Campbell and Company was clear: "Say, for example, on the 60 percent, you lose 1 percent of your capital, but on the 40 percent winning trades you make 2 percent. Over longer periods of time, say a year or more, this would net 20 percent on a broadly diversified program."
In other words, winning and losing trades over time are blended together. Winners make up for small losers. Trend followers rules to enter and exit are driven by what many call technical indicators. The technical indicator for trend followers is price action. However, most traders remain preoccupied with the hundreds upon hundreds of other indicators that promise 'prediction.' They discuss and debate which is better: MACD or Bollinger Bands? Which is more profitable: ADX or Williams %R?
Of course the answer is: none of them. Technical indicators are small components of an overall trading system and are not a complete system. They are like a couple of tools in a toolkit, not the kit itself. A technical indicator accounts for typically 10 percent of the overall trading success of a trend following system. When traders say, "I tried Indicator X and found it was worthless" or "I tried Indicator Y and found it useful," they make no sense. These statements imply an indicator is the actual trading system. By itself, a technical indicator is meaningless. Bottom line, because trend followers never know which trend will be their big winner, they accumulate small losses trying to find it. It's like sticking the toothpick in the cake to find out if it's done. They are testing the market to find out if the little trend will grow into a big trend. Hence, you can end up with the 60-percent losing trades.
All this said what is a concrete example of entry?
The famed trend following "Turtles" learned two breakout variants or 'systems.' System One (S1) used a four-week price breakout for entry and a two-week price breakout in the opposite direction of the entry breakout for an exit. If a market made a new four-week high, the Turtles would buy. They would exit if/when it made a two-week low. A two-week low was a ten-day breakout - counting trading days only. While the System One entry rule is straightforward, the Turtles were taught extra rules to confirm whether or not they should take the four-week breakout. The extra rules were called 'filters,' and they were designed to increase the odds that when the Turtles took a four-week breakout signal, it would continue as a potentially big trend. The filter rule: The Turtles ignored the System One four-week break-out signal if the last four-week breakout signal was a winner. Even if they did not take the last four-week breakout signal, or even if it was just 'theoretically' a winning trade, the Turtles still didn't take the System One breakout. However, if the trade before a current four-week breakout was a 2N loss, they could take the breakout ('N' was simply their measure of volatility). Additionally, the direction of the System One four-week breakout was irrelevant in terms of the filter rule. If their last trade was a short losing trade and a new long or short breakout hit, they could take that breakout and get in. But this filter rule had a built-in problem. What if the Turtles skipped the entry breakout (since the last trade was a 'winner') and that skipped breakout was the beginning of a hugely profitable trend that roared up or down? Not good to be on the sidelines with a market taking off! If the Turtles skipped a System One four-week breakout and the market kept trending, they could and would get back in at the System Two eleven-week breakout. This fail-safe System Two breakout was how the Turtles kept from missing big trends that were filtered out. System Two was the Turtles' longer-term trading system. It used an eleven-week breakout (fifty-five days) for an entry signal and a four-week breakout (twenty days) in the opposite direction for an exit.
So what is another good example of trend following specifics? The nitty gritty?
In the quest for trading success, many traders are seduced into a fruitless search for a perfect entry or exit technique. While they hunt in vain, they miss some very simple strategies that enhance trading returns yet do not involve entry or exit. One strategy most traders overlook altogether is risk equalization. Risk equalization allows a speculator to make proportional adjustments to their account while staying within their tolerance for risk. Risk equalization means you adjust the number of contracts or shares to stay within predetermined risk guidelines. For instance, a trader wouldn't trade a Corn futures contract the same as he would trade an S&P 500 futures contract. The two contracts are dissimilar in size and move differently.
Frequently however, traders get a 'lot size' mentality. They are comfortable trading one contract of many markets, but get skittish at the possibility of having 10 contracts on one instrument and 2 on another. Many traders become anxious if they have different contract sizes in different markets. If you suffer from this anxiety don't let it get you down. Professional and seasoned traders get caught in this trap.
Consider a trading program that did not risk equalize their portfolio. During 2003 this program returned north of 40%. Money under management quickly blossomed from less than a million dollars to over $20 million in just (Figure 1 & Figure 2) a month period.

All indications pointed to a very promising future. But a while back I noticed they were trading one CME Eurodollar contract and one CBOT Ten Year Note contract concurrently. A trader with just a few months of experience realizes, in terms of risk, one Eurodollar is not equal to a single Ten Year Note contract. In comparison with the Ten Year Note, Eurodollars typically have a smaller margin requirement and smaller daily fluctuation. The trade ended with Eurodollars up and Ten Year Notes down. Since risk was not equalized, the two positions netted a loss. If risk had been equalized then the trades would have netted to nearly break even.
This program ended down more than 50% and their assets under management quickly dwindled back to a few million dollars. There is no doubt that inadequate risk management, specifically risk equalization, shortened the life of their program.
The good news? There are several methods you can use to equalize risk on your own. For example, what if you're a futures trader? Futures traders have a distinct advantage due to margin. Exchanges and brokerage firms factor in market volatility to set margin requirements. Simply stated, markets with high margin have a larger daily monetary fluctuation than those with a low margin requirement. A market with a $500 margin requirement will move slower than a market with a $5,000 margin requirement. Recall the Eurodollar/Ten Year Note example. At the time CME Eurodollars have a margin requirement of $400 and CBOT Ten Year Notes' margin is around $1,200 You can quickly see it takes 3 contracts of Eurodollars to equal one contract of Ten Year Notes. Another method of risk control involves measuring the risk you want to take on each trade or fixed fractional trading. Fixed fractional trading simply means you trade the same percent of your account on each trade. For instance 5% risk per trade on a $25,000 account means you use a maximum of $1,250 per trade. (Figure 1) As the account increases in value so does the risk per trade. At $35,000 5% risk per trade equates to $1,750. (Figure 2) Risk for each market does not exceed 5% of the total account size in either example.
Your personal situation may be different, but the math works the same. The risk in dollars fluctuates as the account increases or decreases in size; however risk is always contained to a fixed percent per trade. This method is versatile enough to accommodate stock traders too. Your monetary risk is the distance between entry price and the stop setting. For example: if you own a stock at $50.00 per share and use a stop of $46.00 then monetary risk is $4.00. If you wanted a maximum risk of $1,250 then divide $1,250 by $4.00 to get the number of shares, or 312 for this example. Implementing this type of risk control allows you to take advantage of your trading capital without becoming over extended on one trade. Both novices and veterans must fight the temptation to become married to one trade. This temptation can force you to take a larger position because you feel a trade will work out regardless of short-term fluctuations. Most times the trade never works out as expected and losses mount, the unenviable position of most investors who simply buy and hold. You may even be forced into retirement with extreme losses. Having a clearly structured money management scheme you adhere to allows you to promptly size up risk and control it. Manage risk or it will manage you. Don't be a trader who is afraid to take bigger positions in smaller markets. Subscribe yourself to the old trading axiom, trade all markets equally and equally trade all markets.
What are some of the top reasons to trade as a trend follower?
Profit in Up and Down Markets:
Trend following doesn't swear an allegiance to a bull or bear market. It follows trends to the end. No matter how ridiculous trends might appear early and no matter how insanely extended they might appear at the end, follow trends. Why? Because they always go further than anyone expects. Ignore momentum at your peril.
No More Buy and Hold, Analysts or News:
Trend following decision-making doesn't involve discretion, guesses, "gut" feels or hunches. It's not day trading or buy and hold (hope). It doesn't involve passive indexing, in and out trading or fundamental . No more 24-hour news cycles, daily turbulence or sensational hype. No black boxes or magic formulas either. Hope is the most addictive drug. Let go of the Holy Grails.
No Prediction:
Trends exist everywhere, always coming and always going. Whether fashion, business or whatever, we all want to find trends and ride them as far as they can go. Markets are no different: they trend up and down too. That said, no one can predict a market trend, you can only react to them. Trend following never anticipates the beginning or end of a trend. It only acts when the trend changes. However, there is no need to figure out "why" a market is trending - just follow it. You don't need to understand electricity to use it!
The Big Money of Letting Profits Run:
Trend following aims to compound absolute returns. It doesn't shoot for "average." Do you really want to be exactly like your neighbor? The goal is to make the big returns, not generate passbook savings returns. Trend following also has the unique ability to lie in wait for "targets of opportunity." That means "outlier" events (read: unpredictable surprises like the 2008 market crash) can make you huge money.
Risk Management is Top Priority:
Trend following always has defined exit protocols to control "injury" to your account. Stop losses and proper leverage usage are standard practice. Trend following also has low to negative correlations with most other investment opportunities. It eliminates exposure to group think and toxic assets. Eliminating exposure is a winning move whereas hedging can actually increase your exposure. Trend following is the best protection for when bubbles pop and everyone starts running for cover.
Takes Advantage of Mass Psychology:
Markets, which are always changing, are only our subjective expectations reflected objectively. Interestingly, people's reactions to change always remain the same (i.e., they bet wrong as a group). Trend following takes advantage of "panicky sheep" behavior to make money. How? Strict discipline minimizes behavioral biases. It solves our eagerness to realize gains and reluctance to crystallize losses. Let's face it: too many people believe what pleases them and social conformity means that even if the group is wrong, we go along. Most behaviors are simply driven by the impulsive moment of now. They aren't purposeful, thought-out choices. Trend following wins because of that.
Scientific Approach to Trading:
Trend following doesn't require a belief, but rather it relies on unwavering principles proven over decades. It has a defined edge just like the MIT card counting team that beat Vegas casinos (read: mathematical game theory from the movie "A Beautiful Mind"). Be the casino and not the hapless player! How? Trend following uses hard rules rooted in numbers (think process not outcome). And remember, frequency of correctness does not matter, the magnitude of correctness matters! "Winning percentage" means zilch. How much time will trend following take? No staring at the screen drinking Red Bulls! Once you are setup, minutes a day is all you need when you approach trading like an engineer.
Strong Historical Performance in Crisis Periods:
Trend following prepares for the worst at all times. It is adaptable to differing climates and environments performing best during periods of rising volatility and uncertainty. Guess what? The unknown will happen again! Are you ready? You have to be able to ride the bucking bronco while also riding the storm out. But that said, the day you have to do something, you are screwed. Trend following, like a lion waiting to strike wounded prey, is very patient.
No Traditional Diversification:
Trend following is not restricted to any single market or instrument. A focus on "price action" allows trend following to be applied to an exceptionally large variety of markets. Price is the one thing all markets have in common. That means a system for treasury bonds will work on the Euro too. And if you switch it over to coffee, something totally different than treasury bonds, it still works. Trend following is robust! But don't expect the "tape" to lecture you. You have to trust your buy and sell signals and follow all rules.
No Government Reliance:
Forget Social Security, bailouts, stimulus plans and roads to nowhere. Those won't help you to make money, but they might help you to lose money. When the Fed takes the "training wheels" off the economy will you be ready to mint cash or will you just sit there and take it again? If your portfolio is grounded in sound principles you can win, but the government has nothing to do with sound anything.
Is all this really needed? Yes.
There will be another fall 2008. Guaranteed. When? Who knows. But it will come. And there is only ONE strategy capable of making money when the unpredictable hits the fan. There is only one strategy that has strong historical performance during crisis periods: Trend following. That's it.
But being ready for it, being prepared for that risk, is hard for many reasons. Charles Faulkner (in my film 'Broke') has talked of the problems inherent in the "Socialization of Risk":
"Everyone thinks..."
"The street says..."
"It's only/just..."
"Don't worry ..."
"It always does this..."
Do you think like that? Well, when the next crash happens you will be toast. Dead and buried. Broke? No doubt. Why does trend following do well during rough times? Consider wisdom from trend trading pro Ken Tropin about those unpredictable "events" that sink mutual fund holders (edited down some):
"The reason trend following performs so well when equity markets perform worst is both straightforward and almost tautological: some of the best trends occur in financial markets when equity markets perform poorly. Trend following has a high negative correlation to equity markets during periods of perceived crisis in those markets...because a global consensus emerges about macroeconomic conditions which cause various markets, particularly currencies, interest rates and equities to move in tandem. When this consensus is further confronted by an event, such as a major country default, the event will reinforce the crisis mentality already in place and drive those trends toward their final conclusion."
Further:
"Events do not happen in a vacuum. They are often defined as events because markets are already preconditioned to fear bad news. This is the reason trend following rarely gets caught on the wrong side of an event."
Read Chapter 4 of my book Trend Following again. Event, after event, after event. All unexpected, all trend following winners.
Look at this performance:

That is an "old pro" trend following index (equal weight of trend following legend traders Dunn WMA, JWH F&M and Millburn) compared to buy and hold stock investing. That's a nutso comparison. In fact, it's no comparison.
Don't forget, no matter what the market is doing (up, down or sideways), risk lies dormant, but always "alive". And when the chaos appears in full force again, and it's always coming again, will you be extremely profitable or just looking to the government for a handout?
That's the way to start trading like a trend follower.
About the Author:
Michael W. Covel is the author of the bestselling books "Trend Following" and "The Complete TurtleTrader." He also directed the documentary film "Broke." He is an acknowledged expert in the field of trend following trading and training. His unique vision, along with his blue ocean executive decisions, allowed an initial hunch to grow into one of the most respected educational providers in the world. Covel's firm, Marylebone Holdings, Ltd. (d.b.a. TurtleTrader), is a privately-owned trend following trading consultancy and publishing company that has been training clients since 1996 across 73 countries. The firm is the market leader in fulfilling the lifelong education needs of self-directed trend following investors and traders.
Back to top
Support Tip
How do the different order types affect the price at which a trade is entered?
Contributed by Equis Support
For MetaStock versions 8-11
There are four order types used in the Enhanced System Tester:
Market Order: Market uses whatever price was set in the system tester options for the current simulation.
The remaining three allow you to specify a price for a hypothetical trade. Each of the three, react to the prices differently.
Limit: The order seeks the best price available above or below (depending on the Order Type) the given limit price.
Stop: The order seeks the best market price available once a given limit price has been met or exceeded in a direction defined by the Order Type.
Stop Limit: The order seeks the best price available above or below (depending on the Order Type) a given limit price once that limit has been met or exceeded in a direction also defined by the Order Type.
To show those differences, three examples are detailed below. For all the examples, assume a price bar with a High of $27.20, a low of $26.04, a close of $26.82, and that the trade is a long trade.
If the order price is set to $26.00:
A limit order will not be executed
A stop order will enter at $26.82
A stop limit order will not be executed
If the order price is set to $27.00:
A limit order will enter at $27.00
A stop order will enter at $27.00
A stop limit order will enter at $27.00
If the order price is set to $28.00:
A limit order will enter at $26.82
A stop order will not be executed
A stop limit order will not be executed
Back to top
MetaStock Features
QuoteCenter Review
Contributed by David Derricott
Thomson Reuters is very well known worldwide as a news and data provider. QuoteCenter is the premier news and data feed program available to the individual trader as part of the MetaStock product line. QuoteCenter is more than just a data feed for MetaStock; it is a full program encompassing news and analytics of its own. Even if you are familiar with QuoteCenter, you may not be fully aware of its extensive capabilities and how valuable it is in today's market.
In fact, it is so powerful and comprehensive, that there are customers using QuoteCenter as a standalone product. Take a closer look at QuoteCenter and you may be very surprised at the extraordinary resources available. It is, by far, one of the most powerful tools available to the individual trader.
QuoteCenter provides professional level real-time data for worldwide markets, Stocks, Commodities, Options, and FOREX. 17 years of fundamental data is available for various countries, and an amazing 10 page daily markets called "The Day Ahead" (This alone could cost you hundreds of dollars from any other company). News is delivered from Reuters, Dow Jones, Factiva and other sources to keep you abreast of the most current developments affecting the markets you follow.
Access to vital information provides an incredible advantage to traders. But the news features of QuoteCenter are only the beginning. To name just a few other highlights:
MarketWatch: A dynamic quote screen of over 700 data fields tracking information basics such as last sale, bid, ask, volume, percentage change for the day, etc. You can also monitor data such as fundamentals and indicator values in your watchlist. Additionally, MarketWatch allows you to import your own portfolios, database files, and add headings to keep track of securities by group or industry.
Dynamic Times and Sales: A dynamically updating display allowing you to watch and track every trade for an instrument throughout the day.
Athena Graphics: Basic charting with built in indicators and charting styles.
OptionsWatch: Easy monitoring of option lists. Best of all the OptionWatch does not take away from the built in symbol limit of 500 simultaneous symbols.
Data depth and breadth: We provide historical data on fundamentals, tick, intraday, daily data, and a robust news offering.
These and many other features are included with each QuoteCenter subscription. Additionally, your QuoteCenter desktop is highly customizable.
This program can be used by day, swing, position and end of day traders.
QuoteCenter is a professional level resource. As an individual trader, you may want to take another look to see its full potential and how it may powerfully impact your trading decisions.
-
17-09-2012 08:30 AM #15
- Ngày tham gia
- Oct 2003
- Bài viết
- 365
- Được cám ơn 215 lần trong 148 bài gởi
Những series bài hay về phần mềm phân tích kỹ thuật PTKT MetaStock
Đây là series những bài nghiên cứu chuyên sâu về phần mềm phân tích kỹ thuật PTKT MetaStock
Up In Arms
Contributed by Dick Arms
All of the opinions expressed are based entirely on technical considerations, and founded on the unique methods discussed in Mr. Arms' various books. These are trading suggestions, and are often in fast moving and speculative issues. Traders should be aware of the risks involved in such an approach. Illustrations are Equivolume charts. In this charting method volume rather than time is used for the horizontal axis. Each box, therefore, represents one day of trading, with its width representing the relative volume for that day, and its top and bottom representing the high and low for the day. Readers may want to familiarize themselves with this methodology by reading one or more of the books. The charts are shown courtesy of MetaStock. For more information see www.metastock.com/arms.
ABSOLUTE PERCENT CHANGE (APC)
In recent columns I have referred to the Absolute Percent Change, or APC, usually when writing about market indicators but I have not gone into details on its derivation, its interpretation, or its importance. Therefore, instead of my usual column I would like to spend a little time explaining this simple but valuable indicator I recently developed. It is a very basic market measurement that should, one would think, have been developed and studied a century or more ago, but I have been unable to find any reference to this calculation in any of my references. I stumbled across the idea and started to look at it in a basic form, applying it to the Dow Industrials some years ago, but more recently I have become aware that it is applicable to individual stocks and even to other instruments such as commodities.
THE BASIC REASONING
I observed markets (and later stocks and commodities) tend to show less movement as they get near tops. On the way up or down the day-to-day changes tend to be larger; larger in both directions. And, surprisingly, the biggest changes tend to come in on bottoms. Evidently fearful selling at bottoms is a far more powerful emotion than the excessive greed evident as tops are made. Therefore it made sense to try to illustrate this. To do so I merely calculated the day-to-day percentage change, ignoring whether it was up or down, and smoothed the results. The result was amazing.
CALCULATION
One needs only to take the change in price from one day to the next, and divide it by the current price in order to eliminate price bias. The result is expressed as an absolute. In other words, whether the change is up or down is immaterial. I then run a moving average of the data, usually using a ten-day. To make it easier one can apply a simple formula to MetaStock charts as shown in the examples that follow. I prefer to change the vertical scale by inverting it and using a log scale, in order to make the results easily equated to price. The highs in the APC thereby tend to align with highs in the security, and vice versa.
On the chart below we are looking at a daily chart of the Nasdaq Composite, using the Equivolume methodology. Above it is the APC, inverted and on a log scale. Note how well the highs and lows of the APC match the highs and lows of the Nasdaq. It is apparent that extremes in the APC are strong signals of likely future direction. Selling when the APC is low, or buying when it is high could prove unhealthy in most cases. Keep in mind the APC is an oscillator, and does not contain a price level. So, whereas a market can go higher and higher or lower and lower, an oscillator is restricted to a band. The Nasdaq has been in a steady climb, but the APC has gone to plus and minus extremes, alerting us to the swings on the way up.

Now let's look at an individual stock. Here is Microsoft over the last nine months. Again, look at the way in which an erratic series of waves has been defined with an oscillator.

And finally, let's take a look at Crude Oil. It too seems to be giving us good signals.

In future columns I will often be referring to the APC, and including it on many charts. Readers who want to do it themselves might wish to check out the MetaStock charts at www.MetaStock.com/arms. The formula needs to be inserted as it is not yet a part of the MetaStock menu. It is: Mov(Abs((C-Ref(C,-1))/C),10,SIMPLE);
About Dick Arms
Dick Arms' Equivolume charting and Arms Index are a part of the MetaStock programs. He is the author of six investment books, and writes a twice weekly column for the Realmoney site on thestreeet.com, as well as a weekly advisory letter for institutions.
Article reprinted by permission from thestreet.com.
Back to top
Support Tip
How do I change to the next security without using the mouse?
Contributed by Equis Support
For MetaStock versions 6.52 - 11
First you must have an open chart in MetaStock.
ALT + Left arrow will display the previous security
ALT + Right arrow will display the next security
If you have opened a security in a local folder or a group or sub group of the symbol database (let’s take the NASDAQ 100 for example), when using the above method, you will scroll from one security to the next (in alphabetical order) in the NASDAQ 100 folder.
If you open a security from the root level of data on demand (using the Reuters DataLink or QuoteCenter/eSignal button), it will go to the next security within the entire symbol database alphabetically. For example, if you open Google and scroll to the next security, it would open Golden Opportunities Corp.
There are additional parameters that can be applied to this scroll function. To learn more, please visit the help within MetaStock, searching on “scanning charts”.
Back to top
MetaStock Features
Fine Tuning Your Trading with MetaStock
Contributed by Derek McKusick
The most successful traders are systematic and methodical. MetaStock has been the industry’s technical standard bearer for decades precisely because it equips traders with the best tools allowing them to make trading decisions based on set criteria and reliable rather than emotion and spur of the moment hunches. There is much wisdom in the “if it ain’t broke, don’t fix it” maxim when it comes to a trader’s system and approach to buying and selling in the markets.
However, MetaStock also provides extraordinarily comprehensive, versatile and customizable features and tools so a trader may adapt to changes in their trading environment. It could be worthwhile to occasionally look for opportunities to expand beyond your current approach to trading.
Just a few MetaStock features for your consideration that may help maximize your trading experience with MetaStock:
A library of add-ons and plug-ins developed in conjunction with trade experts to bring additional expertise to your desktop.
The Formula Primer to teach you the process of creating your own customized Indicator, System Test, Exploration and Expert Advisor. There is an impressive database of custom formulas easily accessible from our website. The MetaStock Support team also offers a formula writing service.
A vast array of live, recorded and written resources that teach the specific features of MetaStock products and trading insights from industry experts.
Various subscription and purchase options to get the best value for your current or new MetaStock product.
Learn from and interact with experts at live seminars and at our upcoming annual MetaStock Conference 2010.
Comprehensive technical support.
The User Groups and the MetaStock Forum provide the benefits from sharing expertise, experience and knowledge within a community of MetaStock users.
-
17-09-2012 08:42 AM #16
- Ngày tham gia
- Oct 2003
- Bài viết
- 365
- Được cám ơn 215 lần trong 148 bài gởi
Những series bài hay về phần mềm phân tích kỹ thuật PTKT MetaStock
Đây là series những bài nghiên cứu chuyên sâu về phần mềm phân tích kỹ thuật PTKT MetaStock
You know Fibonaccis, but do you know Fibonacci Time Studies?
Contributed by John Jagerson
Most traders using Fibonacci will stick to retracements, projections and fans, which is fine but Fibonacci can be enhanced by using time projections as well. Fibonacci time forecasts are applied to a chart like other Fibonacci studies but are based on the actual number series rather than the ratio between the numbers in the Fibonacci series.
What is a Fibonacci Time Study?
A time forecast uses the Fibonacci number series (1,1,2,3,5,8,13,21...) to identify potential "areas of interest" in the future. They are applied easily to a chart at a significant price bottom or top. Usually it is applied at the same price point you would have used for the first or second anchor point of a Fibonacci retracement or fan study. The study appears on the chart as a series of progressively wider vertical lines.
Fibonacci Time Study applied to a chart of the SPDR S&P 500 ETF (SPY)

In the chart above you can see how the vertical lines coincided with a short correction to the downside in July and a strong bounce off support recently at the end of August. Picking those two points out of the other potential signals was intentional. Later in this article I will explain why these two points were so interesting.
Most of the time, you should ignore the first five or six very closely clustered vertical lines as noise and not very relevant. However, you should start paying attention to the wider spaced 7, 8, 9 and 10 lines. There are lines beyond that, but they begin trending out so far into the future that you will probably have updated your by then.
When to use Fibonacci time studies
Whenever you're in a trade the time study will help you watch for levels at which reversals are more likely to occur. When you are looking for new trade opportunities with a retracement or fan study, the time forecast can be used to add to the probability of a successful outcome.
Time forecasts also add weight to potential support or resistance levels and help identify when a bounce or change of trend could appear. Knowing where and when you may want to pay the most attention to your is a great way to optimize your trading efforts.
Fibonacci time studies in action
Combining the Fibonacci time projection with a Fibonacci retracement can help clarify the signals and make them much more predictive. In the next chart I have left the time projection at the same point but have layered a Fibonacci retracement anchored between the major high in April and the lowest point of the current channel in July. The chart is getting a little crowded but with a little practice it isn't too difficult to see the signals.
Fibonacci Time Study and Retracement applied to a chart of the SPDR S&P 500 ETF (SPY)

The time study coincided with two of the retracement levels on the chart. Unlike most technical indicators that rely on historical data, Fibonacci retracements and time studies aren't relying on historical data and therefore don't necessarily add any lag to your entries or exits. This is a big advantage when using more than one indicator at a time.
The time projection can tell you, in advance, when you should be paying the most attention to a potential support or resistance bounce. Expanding your chart to the right can show you the future time study levels so you can make sure you are paying attention on those dates specifically.
How to draw time projection studies
We recommend the Fibonacci time projection be applied in combination with a retracement or fan study. The time projection should be attached to a major top or bottom in the trend just like you would with other fibonacci studies. Because the time projection lines or intervals are fixed, a second anchor point is not usually required.
Ignore the first five intervals
Because the time projection is based on the Fibonacci number series the first interval will be drawn one candle away from the anchor, the second interval will also be one candle beyond the first one, the third will be 2 candles away from the second interval, the fourth interval will be 3 candles from the third, the fifth interval will be 5 candles away from the fourth and so on... (1,1,2,3,5,8,13...)
As a result, the first few intervals are not much more than static. Save yourself some effort and feel free to ignore them. The sixth interval is where you should begin your .
Planning a trade
You should design your trade in the same way you would when using a Fibonacci retracement. Do not take more risk than you might normally, as trading is all about consistency and it is bad practice to radically change your position size from trade to trade.
Using time studies to control risk
As with all Fibonacci studies, time projections can be a good warning the current trend could be disrupted. It does not mean you have to get out of your trade just because a time projection interval appears, but it may be a great time to be more conservative in your risk control.
Frequently however, traders get a 'lot size' mentality. They are comfortable trading one contract of many markets, but get skittish at the possibility of having 10 contracts on one instrument and 2 on another. Many traders become anxious if they have different contract sizes in different markets. If you suffer from this anxiety don't let it get you down. Professional and seasoned traders get caught in this trap.
John Jagerson, Analyst at Learning Markets
About Learning Markets
Learning Markets offers daily articles, videos and investing guides - for free - about everything from investing in stocks and options to trading currencies in the forex market and more. Visit LearningMarkets.com to learn more about investing and to interact with other investors just like you.
Back to top
Support Tip
How can I find a MetaStock User group in my area?
Contributed by MetaStock Support
For all MetaStock versions
MetaStock has many active user groups located around the world. User groups are created by MetaStock enthusiasts as a place where MetaStock users can meet, share ideas, and learn how to better use their MetaStock software. Most user groups do not have any fees associated with them and meet on a regular basis.
User Group Search (United States and International): http://www.equis.com/customer/resources/usergroups/
MetaStock Public Forum: http://forum.equis.com/search/Search...?q=user+groups
Back to top
MetaStock Features
John Murphy's Chart Pattern Recognition Review
Contributed by Ken Spelman
This multi-award winning add-on from John Murphy is one of the most popular and easiest to use add-ons available for MetaStock. If you can run a basic scan using the Explorer tool in MetaStock, you can use this program.
CPR can be used for all types of securities - Stocks, ETF's, Commodities, e-mini's or Forex. It should be used with daily data and I have found it best when used on a large block of securities. The program can scan for both Reversal Patterns and Continuation Patterns. Here are the patterns it scans for:
Reversal Patterns:
Head and Shoulders
Inverse Head and Shoulders
Triple Tops
Triple Bottoms
Double Tops
Double Bottoms
Continuation Patterns:
Symmetrical Triangles
Ascending Triangles
Descending Triangles
John Murphy's Chart Pattern Recognition scans for all patterns at one time and gives you a nice, easy report. CPR goes beyond simply identifying the patterns on your chart. Each pattern is computer-verified and supplemented with John Murphy's own expert commentary. Simply click on the identified pattern to read the specific details on how he feels this pattern rates. Was the breakout from the pattern significant enough to warrant a trade? What is the likely price projection for this type of pattern? How long will it likely take to reach the projected price? You'll get all of this trading detail and more!
Chart Pattern Recognition has won numerous awards from the prestigious Technical of Stocks and Commodities Magazine Readers' Choice Award plug-ins category. It was the winner from 2006-2009 and first runner up from 2004-2005 and 2010.
-
18-09-2012 08:38 AM #17
- Ngày tham gia
- Aug 2010
- Bài viết
- 648
- Được cám ơn 325 lần trong 218 bài gởi
Những series bài hay về phần mềm phân tích kỹ thuật PTKT MetaStock
Đây là series những bài nghiên cứu chuyên sâu về phần mềm phân tích kỹ thuật PTKT MetaStock
Gap Quotient
Contributed by Steve Lentz
Gaps are the enemy. Yes, that's right. Some traders have real enemies in life and gaps can rank right up at the top.
At DiscoverOptions, we teach non-directional short option premium strategies used successfully by both our mentors and money manager students. One fly in the ointment for these approaches is price gap in the underlying asset from the closing price to the next day's open price. Large gaps can occur quite often with individual stocks due to company announcements and unexpected events. That's why we prefer applying these strategies with index options so that company risk is greatly mitigated.
But regardless of what underlying assets you trade, you should be aware how gaps affect that market relative to other assets. To illustrate, let's take in Figure 1 below at the gap behavior of the SPY during the crash of 2008.

Figure 1
Before September 2008, SPY opening gaps were well under 1%. But then on 9/19 and 10/13 of that fall, the SPY had gaps of 5.5% and 6.0% respectively. Up to this time, these were rivaled only by the post 9/11 gap on 9/17/01 of 8.2%.
More important, though, is the overall character of an asset's gap behavior. We calculate this through the use of average gap levels. Although daily gaps are charted in Figure 1 above, we can take an average of the most recent 20 trading days' gaps and display it with the gap levels.

Figure 2
The gap levels were multiplied by 100 for decimalization and scaling purposes.
In Figure 2 above, the solid black line is the Gap Quotient (GQ) which is a 20-day simple moving average of the opening gaps. See how the GQ before September was well under 1% and then rose to over 2% by the end of September 2008.
It's now time to rank several assets by their Gap Quotients, and in MetaStock we do this through the Explorer feature. Figure 3 below displays the formula for the Gap Quotient within the Explorer feature. Digitally, it reads as follows:
Mov((Abs(OPEN-(Ref(C,-1)))/Ref(C,-1)),20,S)*100

Figure 3: Gap Quotient Formula
We now run Explorer on a group of pre-selected candidates and, for us at DiscoverOptions, we like to use a list of underlying assets with very tight spreads between the option bid and option asked prices.
Figure 4 below displays Gap Quotient Rankings from a list of 21 stocks and ETFs that have very tight option bid/asked spreads. These came from a scan I did within OptionVue's OpScan service that can query option bid and asked prices.

Figure 4: Gap Quotient Rankings
With a GC of .306%, the DIA clearly has more stable opening gap behavior than FCX with a GC of over three times as much at 1.167%. This is valuable information if you are an option premium seller and wish to avoid the early morning excitement that opening gaps can bring.
Of course, some trading approaches might favor opening gaps and in that case a trader could invert the approach and rank assets with the highest Gap Quotients at the top. In this case, I suppose we could amend the opening declaration to say, "Gaps are my best friend".
About Steve Lentz
Steve Lentz is the Director of Education and Research at DiscoverOptions, the educational arm of OptionVue Systems, Inc. He can be reached via email at Steve@DiscoverOptions.com or via phone at 847-816-6610.
Back to top
Support Tip
What are the various country codes for the QuoteCenter application?
Contributed by Equis Support
For all QuoteCenter and MetaStock versions 9.1 - 11
Country codes are used as a prefix to symbols (see examples below)
US;IBM (US = United States)
AU;AAC (AU = Australia)
AE;ACICO (AE = United Arab Emirates)
Country Codes
AE=United Arab Emirates
AF=Afghanistan
AG=Antigua and Barbuda
AL=Albania
AM=Armenia
AN=Netherlands Antilles
AO=Angola
AQ=Antarctica
AR=Argentina
AS=American Samoa
AT=Austria
AU=Australia
AW=Aruba
AZ=Azerbaijan
BA=Bosnia and Herzegovina
BB=Barbados
BD=Bangladesh
BE=Belgium
BF=Burkina Faso
BG=Bulgaria
BH=Bahrain
BI=Burundi
BJ=Benin
BM=Bermuda
BN=Brunei
BO=Bolivia
BR=Brazil
BS=Bahamas
BT=British West Indies
BV=Bouvet Island
BW=Botswana
BY=Belarus
BZ=Belize
CA=Canada
CC=Cocos Islands
CF=Central African Republic
CG=Congo
CH=Switzerland
CI=Cote D'ivoire
CK=Cook Islands
CL=Chile
CM=Cameroon
CN=China
CO=Colombia
CR=Costa Rica
CU=Cuba
CV=Cape Verde
CX=Christmas Island
CY=Cyprus
CZ=Czechoslovakia
DE=Germany
DJ=Djibouti
DK=Denmark
DM=Dominica
DO=Dominican Republic
DZ=Algeria
EC=Ecuador
EE=Estonia
EG=Egypt
EH=Western Sahara
ER=Eritrea
ES=Spain
ET=Ethiopia
FI=Finland
FJ=Fiji
FK=Falkland Islands
FM=Micronesia (Federated States of)
FO=Faroe Islands
FR=France
FX=France (Metropolitan)
GA=Gabon
GB=United Kingdom
GD=Grenada
GE=Georgia
GF=French Guiana
GH=Ghana
GI=Gibraltar
GL=Greenland
GM=Gambia
GN=Guinea
GP=Guadeloupe
GQ=Equatorial Guinea
GR=Greece
GS=South Georgia and The South Sandwich Isl
GT=Guatemala
GU=Guam
GW=Guinea-Bissau
GY=Guyana
HK=Hong Kong
HM=Heard-McDonald Islands
HN=Honduras
HR=Croatia
HT=Haiti
HU=Hungary
ID=Indonesia
IE=Ireland
IL=Israel
IM=Isle of Man
IN=India
IO=British Indian Ocean Territory
IQ=Iraq
IR=Iran
IS=Iceland
IT=Italy
JM=Jamaica
JO=Jordan
JP=Japan
KE=Kenya
KG=Kyrgyzstan
KH=Kampuchea
KI=Kiribati
KM=Comoros
KN=Saint Kitts And Nevis
KP=North Korea
KR=Korea
KW=Kuwait
KY=Cayman Islands
KZ=Kazakhstan
LA=Lao People's Democratic Republic
LB=Lebanon
LC=St. Lucia
LI=Liechtenstein
LK=Sri Lanka
LR=Liberia
LS=Lesotho
LT=Lithuania
LU=Luxembourg
LV=Latvia
LY=Libyan Arab Republic
MA=Morocco
MC=Monaco
MD=Moldova
MG=Madagascar
MH=Marshall Islands
MK=Macedonia
ML=Mali
MM=Burma
MN=Mongolia
MO=Macau
MP=Northern Mariana Islands
MQ=Martinique
MR=Mauritania
MS=Montserrat
MT=Malta
MU=Mauritius
MV=Maldives
MW=Malawi
MX=Mexico
MY=Malaysia
MZ=Mozambique
NC=New Caledonia
NE=Niger
NF=Norfolk Island
NG=Nigeria
NI=Nicaragua
NL=Netherlands
NO=Norway
NP=Nepal
NR=Nauru
NU=Niue
NZ=New Zealand
OM=Oman
PA=Panama
PE=Peru
PF=French Polynesia
PG=New Guinea
PH=Philippines
PK=Pakistan
PL=Poland
PM=Saint Pierre And Miquelon
PN=Pitcairn
PR=Puerto Rico
PT=Portugal
PW=Palau
PY=Paraguay
QA=Qatar
RE=Reunion
RO=Romania
RU=Russian Federation
RW=Rwanda
SA=Saudi Arabia
SB=Solomon Islands
SC=Seychelles
SD=Sudan
SE=Sweden
SG=Singapore
SH=St. Helena
SI=Slovenia
SJ=Svalbard and Jan Mayen
SK=Slovakia
SL=Leone
SM=San Marino
SN=Senegal
SO=Somalia
SR=Surinam
ST=Sao Tome and Principe
SV=El Salvador
SY=Syrian Arab Republic
SZ=Swaziland
TC=Turks and Caicos Islands
TD=Chad
TF=French Afars + Issas
TG=Togo
TH=Thailand
TJ=Tajikistan
TK=Tokelau
TM=Turkmenistan
TN=Tunisia
TO=Tonga
TR=Turkey
TT=Trinidad + Tobago
TV=Tuvalu
TW=Taiwan
TZ=Tanzania
UA=Ukrainian SSR
UG=Uganda
UM=United States Minor Outlying Islands
US=United States
UY=Uruguay
UZ=Uzbekistan
VA=Vatican City State (Holy See)
VC=Saint Vincent And The Grenadines
VE=Venezuela
VG=Virgin Islands (British)
VI=Virgin Islands (U.S.)
VN=Vietnam
VU=Vanuata
WF=Wallis and Futuna Islands
XS=Multi Country
YE=Yemen
YT=Mayotte
YU=Yugoslavia
ZA=South Africa
ZM=Zambia
ZR=Zaire
ZW=Zimbabwe
Names
Afghanistan=AF
Albania=AL
Algeria=DZ
American Samoa=AS
Angola=AO
Antarctica=AQ
Antigua and Barbuda=AG
Argentina=AR
Armenia=AM
Aruba=AW
Australia=AU
Austria=AT
Azerbaijan=AZ
Bahamas=BS
Bahrain=BH
Bangladesh=BD
Barbados=BB
Belarus=BY
Belgium=BE
Belize=BZ
Benin=BJ
Bermuda=BM
Bolivia=BO
Bosnia and Herzegovina=BA
Botswana=BW
Bouvet Island=BV
Brazil=BR
British Indian Ocean Territory=IO
British West Indies=BT
Brunei=BN
Bulgaria=BG
Burkina Faso=BF
Burma=MM
Burundi=BI
Cameroon=CM
Canada=CA
Cape Verde=CV
Cayman Islands=KY
Central African Republic=CF
Chad=TD
Chile=CL
China=CN
Christmas Island=CX
Cocos Islands=CC
Colombia=CO
Comoros=KM
Congo=CG
Cook Islands=CK
Costa Rica=CR
Cote D'ivoire=CI
Croatia=HR
Cuba=CU
Cyprus=CY
Czechoslovakia=CZ
Denmark=DK
Djibouti=DJ
Dominica=DM
Dominican Republic=DO
Ecuador=EC
Egypt=EG
El Salvador=SV
Equatorial Guinea=GQ
Eritrea=ER
Estonia=EE
Ethiopia=ET
Falkland Islands=FK
Faroe Islands=FO
Fiji=FJ
Finland=FI
France (Metropolitan)=FX
France=FR
French Afars + Issas=TF
French Guiana=GF
French Polynesia=PF
Gabon=GA
Gambia=GM
Georgia=GE
Germany=DE
Ghana=GH
Gibraltar=GI
Greece=GR
Greenland=GL
Grenada=GD
Guadeloupe=GP
Guam=GU
Guatemala=GT
Guinea=GN
Guinea-Bissau=GW
Guyana=GY
Haiti=HT
Heard-McDonald Islands=HM
Honduras=HN
Hong Kong=HK
Hungary=HU
Iceland=IS
India=IN
Indonesia=ID
Iran=IR
Iraq=IQ
Ireland=IE
Isle of Man=IM
Israel=IL
Italy=IT
Jamaica=JM
Japan=JP
Jordan=JO
Kampuchea=KH
Kazakhstan=KZ
Kenya=KE
Kiribati=KI
Korea=KR
Kuwait=KW
Kyrgyzstan=KG
Lao People's Democratic Republic=LA
Latvia=LV
Lebanon=LB
Leone=SL
Lesotho=LS
Liberia=LR
Libyan Arab Republic=LY
Liechtenstein=LI
Lithuania=LT
Luxembourg=LU
Macau=MO
Macedonia=MK
Madagascar=MG
Malawi=MW
Malaysia=MY
Maldives=MV
Mali=ML
Malta=MT
Marshall Islands=MH
Martinique=MQ
Mauritania=MR
Mauritius=MU
Mayotte=YT
Mexico=MX
Micronesia (Federated States of)=FM
Moldova=MD
Monaco=MC
Mongolia=MN
Montserrat=MS
Morocco=MA
Mozambique=MZ
Multi Country=XS
Nauru=NR
Nepal=NP
Netherlands Antilles=NR
Netherlands=NL
New Caledonia=NC
New Guinea=PG
New Zealand=NZ
Nicaragua=NI
Niger=NE
Nigeria=NG
Niue=NU
Norfolk Island=NF
North Korea=KP
Northern Mariana Islands=MP
Norway=NO
Oman=OM
Pakistan=PK
Palau=PW
Panama=PA
Paraguay=PY
Peru=PE
Philippines=PH
Pitcairn=PN
Poland=PL
Portugal=PT
Puerto Rico=PR
Qatar=QA
Reunion=RE
Romania=RO
Russian Federation=RU
Rwanda=RW
Saint Kitts And Nevis=KN
Saint Pierre And Miquelon=PM
Saint Vincent And The Grenadines=VC
San Marino=SM
Sao Tome and Principe=ST
Saudi Arabia=SA
Senegal=SN
Seychelles=SC
Singapore=SG
Slovakia=SK
Slovenia=SI
Solomon Islands=SB
Somalia=SO
South Africa=ZA
South Georgia and The South Sandwich Isle=GS
Spain=ES
Sri Lanka=LK
St. Helena=SH
St. Lucia=LC
Sudan=SD
Surinam=SR
Svalbard and Jan Mayen=SJ
Swaziland=SZ
Sweden=SE
Switzerland=CH
Syrian Arab Republic=SY
Taiwan=TW
Tajikistan=TJ
Tanzania=TZ
Thailand=TH
Togo=TG
Tokelau=TK
Tonga=TO
Trinidad + Tobago=TT
Tunisia=TN
Turkey=TR
Turkmenistan=TM
Turks and Caicos Islands=TC
Tuvalu=TV
Uganda=UG
Ukrainian SSR=UA
United Arab Emirates=AE
United Kingdom=GB
United States Minor Outlying Islands=UM
United States=US
Uruguay=UY
Uzbekistan=UZ
Vanuata=VU
Vatican City State (Holy Sea)=VA
Venezuela=VE
Vietnam=VN
Virgin Islands (British)=VG
Virgin Islands (U.S.)=VI
Wallis and Futuna Islands=WF
Western Sahara=EH
Yemen=YE
Yugoslavia=YU
Zaire=ZR
Zambia=ZM
Zimbabwe=ZW
Back to top
MetaStock Features
MetaStock Wrote the Book on Technical
Contributed by Derek McKusick
Steven Achelis, the founder of MetaStock, published the first edition of the hugely popular reference guide Technical from A to Z in 1995. Since then it has established itself as required reading for anyone serious about learning and mastering technical .
Whether you are a novice technical analyst or an exceptionally experienced trader, Technical from A to Z must be included in your library.
Overviews, interpretations, explanations, real-world examples, and numerous detailed insights to the calculations behind the indicators are all laid out in an easy to follow format.
It is comprehensive, concise and "user friendly". Its expansive range of information begins simply with common technical terminology and history and eventually encompasses, with full explanations, an incredible range of 135 of the most popular technical indicators. From line charts to Fibonaccis, from Moving Averages to William's %R, from Absolute Breadth Index to Zig Zag. From A to Z....
Technical is predicated on the premise that the better informed and more disciplined a trader becomes, the more sound his trading decisions will be. Consider including Technical from A to Z in your trading arsenal. Whether you are just beginning to learn or want a refresher, the increased level of expertise will give you the extra fire power to win in the markets.Last edited by tradingpro8x; 18-09-2012 at 08:40 AM.
-
18-09-2012 08:47 AM #18
- Ngày tham gia
- Aug 2010
- Bài viết
- 648
- Được cám ơn 325 lần trong 218 bài gởi
Những series bài hay về phần mềm phân tích kỹ thuật PTKT MetaStock
Đây là series những bài nghiên cứu chuyên sâu về phần mềm phân tích kỹ thuật PTKT MetaStock
How to Cash in on Temporary Inefficiencies in the Equities Market
Contributed by Dr. Stephen Cooper
One of the debates that have been carried out in certain financial circles is the idea of "market efficiency" as it relates to the Stock Market. It goes something like this: Are the current prices of stocks and other instruments representative of realistic value? It is argued that by the time an individual investor considers the purchase of a particular stock, future expectations or concerns for example, all the reports (good or bad) have already been factored into the current share price.
If this "efficient market" theory is correct then it becomes challenging for a stock market speculator to find under priced stocks to buy. Viewed on the whole, the stock market certainly does display price efficiency over time. But there is an important dynamic involved that opens windows of opportunity if you know how to find them.
There are in fact brief periods of clear inefficiency in pricing that allow individuals chances to cash in. Because of over-reactions to news or world events, whether good or bad security prices may swing wildly and exceed reasonable short-term valuation changes. These over-exuberant buying or selling sprees pull prices into a condition of imbalance. The market will soon pull these inefficient prices back toward a more normal range and thus return them to relative efficiency.
One of the best ways that I know of to make consistent profits in the stock market is to capitalize on these brief departures from normal/efficient territory by opening positions that benefit from their return to efficiency. I'll show you what I mean.

Figure 1
Share prices of CAH dropped about $10 in one single day in July. This was an enormous percentage loss for CAH. When you see this kind of price change in one day the first question to be asked and answered is, "Why?" What could be so terrible as to cause this kind of carnage? Here is the interesting thing in all this. Quite often the bad news just isn't so bad. Here is an example of the overreaction I mentioned earlier. Market participants both professional and novice very frequently hear some bad or good news and then just go crazy! As price begins to move in reaction to the news a snowball effect can set in where the buying or selling frenzy pulls in more and more traders, exacerbating the situation. When this happens we have a prime opportunity to make some money. What if we were to buy some shares of CAH after we checked the news and decided that the bad news wasn't really so bad after all and that CAH is not going belly up tomorrow morning as the selling might indicate? On the next chart we'll add the price action that took place on the very next day after this incredible selling fit.

Figure 2
In spite of the incredible amount of selling and resultant price loss of CAH during one trading session the very next session showed a good amount of buying and price increase. Enough people had woken up the next morning and said to themselves, "Hey, it's not that bad. CAH is actually a bargain at this price. I think I'll buy me some!" And buy they did.
In fact the buying was not restricted to the day immediately after the plunge but continued on through a number of trading sessions as shown in the third chart, below.

Figure 3
There are a number of trading techniques that take advantage of temporary market pricing inefficiency. Until you become accustomed to using them it does take a bit of courage to go against the stampede of other investors and traders but if you do, the pay-offs can make it well worth the effort.
I suggest that you try this simple technique as explained here with paper trading first. Here is how to do it step by step. I call this "Slamming".
1. Find stocks that have been hammered by 15% or more in one day. You can find these listed at www.OnlineOption.com under RESOURCES/SLAMS.
2. Choose only strong, well known companies to do this with such as those listed on the NYSE.
3. On the day following the slam enter a long position provided that price is rebounding.
4. As with all trades, immediately place a trailing stop order after the position has been opened. With stocks use a dollar amount equal to 10% of the share price paid.
5. If the stock immediately rebounds after the slam day tighten your trailing stop or sell your shares for 10% or more gain.
Conclusion
Though the stock market retains general price efficiency over time there exist brief periods of distinct price inefficiency which can provide highly profitable opportunities for anyone willing to capitalize on them. By following a clear plan of action you can make excellent short-term gains with high probability trades. Open these positions with a small number of shares or contracts, especially if you are a beginning trader. Be sure to first paper trade to gain experience and confidence before committing your dollars to the markets.
About Dr. Stephen Cooper
Dr. Stephen Cooper began studying the stock market in 1985 while in private chiropractic practice. He started his trading experience in the commodities market. This practical experience was followed by stock and option trading. This interest became a passion and Dr. Cooper continued studying the markets and chart along with actively trading over the next 13 years while continuing practice. In 1998, Dr. Cooper retired from his chiropractic practice to become a full-time trader.
Because of his trading success over a number of years, Dr. Cooper was urged to share his trading philosophy and techniques with others. As a result, he authored The Online Option Trader in 1999. This work is designed to take the student from little or no knowledge of the stock market to proficiency in trading stocks and options.
The popular stock and option training site www.OnlineOption.com was created in late 1999 to augment resources available to his students. Now in its 11th year OnlineOption.com has become the research and interaction hub of a vibrant community of traders from around the world.
In 2001, following numerous requests for further training and help with stock charts, Windows to Wealth was completed. This 327 page book is dedicated to the understanding and practical application of chart principals and techniques.
Dr. Cooper is also a popular speaker, writer and trainer, conducting live trading workshops, online courses, personal one-on-one coaching, and ongoing market commentary.
Back to top
Support Tip
How do I create a custom symbol list for a particular index in the QuoteCenter application?
Contributed by MetaStock Support
For QuoteCenter Only
1. Go to your computer and access the Equis International folder.

2. Open the QuoteCenter application. Once in QuoteCenter, go to file and open "New Blank Workspace".

3. Double click anywhere in the whitespace.
4. Select "Marketwatch". There is a list of pre-populated Marketwatch lists on the right hand side under "Select SymbolList". If you want to create your own, select "OK".

5. Type in the symbol field. (This is the first column on the left.)
6. In the symbol field of a MarketWatch type in "..!CountryCode!Symbol". The country code must be in lower case and the symbol must be in all caps. After entering this, you must hold shift when you hit enter.
6a. Example: ..!us!SPX then SHIFT+ENTER.

7. This will populate the marketwatch with all of the symbols contained with the given index symbol.
8. Right click onto the back ground of the MarketWatch and select "SymbolList", then "Save As...". Give it a name and hit "OK".

Back to top
MetaStock Power User Tip
How to Create a Toolbar Shortcut
Contributed by Breakaway Training Solutions
Do you find yourself always applying the same template, layout, or chart? If so, you might want to consider creating a shortcut in order to save time.
At the bottom of your screen, you'll find the existing shortcut toolbar.

Open it up by right clicking anywhere in the toolbar, and select Custom Toolbar Properties. Here you'll be able to create your own shortcut.
Begin by clicking on the New button.

Select Browse.

If you installed your MetaStock program with the default settings, you'll find your templates, layouts and charts installed under C:\Program Files\Equis\MetaStock\Charts.

At the bottom of this window under the Files of Type selection, you'll be able to choose either Template, Layout, or Chart.

Once you make your selection, click the Open button and click the Next button.
Here you'll be able to select the icon that you want to associate with your shortcut.

Once you've made your selection, click Next, Finish and, finally, OK.
If you created a shortcut to a template, you'll first need to make sure that you have a chart loaded on your screen. You should then see your shortcut icon displayed, which you can use immediately to apply your template.
To see Kevin Nelson demonstrate this lesson, just watch this three minute video.
For more MetaStock training, make sure to visit us at www.learnmetastock.com or email us at admin@learnmetastock.com.
About Kevin Nelson
Kevin Nelson is the founder of Breakaway Training Solutions, Inc. He has spent the last 17 years becoming an expert on MetaStock software and a serious student of technical while working for MetaStock. Prior to joining MetaStock in 1993, Kevin was a stockbroker for a well-known NYSE firm. In his role as Sales Manager at MetaStock, Kevin interacted extensively with MetaStock customers via phone, webinars, and public appearances. His experiences while working at MetaStock have enabled him to gain a keen understanding of the needs of technical analysts worldwide. While with MetaStock, Mr. Nelson was a featured presenter for four years. During this time, he traveled the U.S. introducing the MetaStock program to thousands of people and teaching them how to use its many features. His easy-to-understand approach is considered by many to be the best in the industry.
©Breakaway Training Solutions, Inc. 2011Last edited by tradingpro8x; 18-09-2012 at 08:49 AM.
-
Những thành viên sau đã cám ơn :
trunghieuffb (18-09-2012)
-
25-09-2012 09:57 AM #19
- Ngày tham gia
- Oct 2009
- Bài viết
- 1,925
- Được cám ơn 617 lần trong 428 bài gởi
Những series bài hay về phần mềm phân tích kỹ thuật PTKT MetaStock
Đây là series những bài nghiên cứu chuyên sâu về phần mềm phân tích kỹ thuật PTKT MetaStock
March - April 2011 MetaStock Monitor
Importance of Understanding Support & Resistance Levels
Contributed by Dr. John Keppler
Trending & Non-Trending Markets
If we take a close look at any price chart of a liquid and active financial instrument, we will immediately notice that prices usually move in a series of waves or peaks and valleys on the chart.
The direction of these consecutive peaks and valleys provide us with a lot of valuable information about price action and market sentiment. They actually help us to determine the direction of a trend and identify key levels of support and resistance. These valleys and peaks create trading opportunities for traders to enter or get out of trades. Professional traders always like to buy at support and sell at resistance, since these trades will usually have a much higher probability of success.
To help us in understanding theses valleys and peaks, traders need to always keep in mind that an uptrend is defined by a series of consecutive higher peaks or higher highs and higher lows. A down trend, on the other hand, is established when prices follow a sequence of lower highs and lower lows.
In a non-trending market prices stay within a sideways range, we tend to see prices making equal highs and equal lows. The highs and lows are not always at the exact point, but they are usually close to one another. When this occurs in the market, prices are usually consolidating prior to a move. There is no directional conviction in the market when prices become range bound in a sideways market. It is a period of uncertainty; many traders take a wait and see approach to the market.
Support & Resistance
The valleys or lower pivots help us in identifying the support levels, while the peaks highlight price resistance points. A price support point or level is a place where buying interest is sufficiently strong to overcome selling pressure. As a result, prices hold at this level and eventually start to rise. Consequently, they provide great buying opportunities. On the other hand resistance points are the exact opposite of support, they represent price levels where sellers dominate and are able to overcome buyers. Price increases are halted by resistance and eventually prices start to drop.
It’s important to understand that in an uptrend, resistance levels may represent pauses or resting periods in the uptrend and not necessarily reversal points. Similarly, support points in a downtrend may also be a brief intermission in the downtrend and not a reversal of price direction.
It’s critical for a trader to recognize that an uptrend is not broken until prices start to create lower highs and lower lows. Similarly, a downtrend ends as soon as prices start to make higher highs or higher lows.
If a corrective drop occurs in an uptrend that causes prices to drops all the way down to the previous low, but then prices continue to move back up, it may be an early warning sign that the uptrend is weakening and may in fact be close to ending. However, technically speaking as long as the prior low was not broken the uptrend was not broken. Sometimes, the trend is not broken and prices will move sideways for a period of time before continuing to move back up again. Trends are very powerful forces in the market and smart traders should always do their best to stay on the right side of a trend.
Support & Resistance Psychology
To understand the psychology of activity at support and resistance, we need to first understand the different postures or positions that traders may have at any price point. When we arrive at a support level, we are going to find traders that are holding long positions, traders that are holding short positions and traders that are holding no positions but are looking to get in.
At the support level, strong buyers are stepping in and prices are starting to hold. Traders with a long position that entered the trend at a wrong point, and were previously in a losing position, are now pleased that their losses are starting to dwindle and that new prices will start to move their way. They may in fact be looking to add to their positions.
On the other hand, when traders who are short will recognize the support level, they will exit and cover their shorts generating more buying power. Traders that are still outside will fall into two groups, one group realizes prices are rising and they decide to immediately enter and thus help propel prices higher. The other group is still waiting for prices to dip back so they can enter at a better price.
So as you can see there are several groups that are eagerly waiting to buy a price dip. Naturally, if and when prices decline back near support more buying takes place. The support level becomes stronger and prices get an upward lift. Consequently prices continue to push up, until they encounter resistance.
Once again, when we arrive at a resistance level, we are basically encountering supply or strong selling pressure. Recognizing this fact, many traders that are holding long positions will want to get out quickly to capture their profits and thus create an increase to the selling pressure. Traders that did not exit quickly are now dealing with the psychology of watching profits slip away as prices continue to drop before their eyes. They are praying and wishing for prices to move back up to capture a little more profit and capture some of the gains that they had previously seen.
As soon as prices pull back up towards resistance they see this as their opportunity to immediately get out and sell their long position. This in turn creates another wave of added selling pressure. Traders on the sidelines are watching prices and they can see that even when prices pulled back towards resistance they dropped again, this gives many traders on the outside their queue to short and get into the market. Sure enough this creates more added selling volume and continues to push prices lower. The resistance point holds and prices continue to drop until buyers decide to step in creating a level of support. This behavior occurs continuously in the market in every time frame. Consequently, it’s helpful for traders to understand the psychology behind the opportunities that present themselves. It helps them to time their entries better and gain a greater sense of confidence in the market. Knowledge and education are always the best foundation for profitable trading.
About Dr. John Keppler
The Strategic Trading Institute was founded by Dr. Keppler. It provides traders and investors with an outstanding education and powerful set of trading strategies. Its programs deliver a solid & practical market education for trading Stocks, Futures, Forex and Options.Our lead instructor, Dr. Keppler, brings an exceptional level of expertise and teaching experience to all of the courses offered.
Dr. Keppler holds a Bachelor’s degree in Electrical Engineering, a Bachelor’s degree in Business Finance, an MBA and a PhD in Business. He has taught at the University Of Utah School Of Business, the University of California and the College of Notre Dame. He has been a business professor and a strategic trader for over twenty years.
Dr. Keppler has developed a variety of proprietary strategic trading systems and indicators. Utilizing his trading knowledge and educational expertise, he has designed and developed a number of strategic trading educational program. These simple and systematic programs help guide beginners, new traders and investors through the maze of financial markets. Dr. Keppler is nationally recognized for his unique and dynamic style of teaching; he thrives on interacting and coaching his students towards the path of financial freedom.
Back to top
Support Tip
How do I install Reuters Tools into Excel so that I can set up a DDE link between QuoteCenter and Excel?
Contributed by MetaStock Support
For QuoteCenter Only
Have you ever wanted to combine the power of QuoteCenter with Excel? This tip helps you do just that! Linking QuoteCenter and Excel together allows you to export data directly from QuoteCenter into Excel with minimal effort. Once exported into Excel, the data will continuously update itself as long as the market is live. This is also a great way to take advantage of Excel's charting capabilities with QuoteCenter data.
1. Click Customize Quick Access Toolbar pull-down menu.

2. Click "More Commands".
3. Click "Add-ins".
4. Select "Manage Excel Add-ins".
5. Click "Go".

7. Click "Browse".
8. Browse to: C:\ QuoteCenter\USERFILES\XL_Files or C:\Program Files\Equis\QuoteCenter\XL_Files (in older versions of QuoteCenter).
9. Double click "Btools.xla".
10. Click "OK".
11. To use, open Add-ins menu.
12. Select Reuters Tools and desired tool (such as symbol table).
Back to top
MetaStock Power User Tip
Backing Up MetaStock
Contributed by Breakaway Training Solutions
Do you have a backup of your important MetaStock files for safe keeping?
Computer problems are no fun for anyone so it's extremely important that you always have a backup of your important files. Here's a really simple way to back up your MetaStock program so you don't lose your hard work.
First of all, you need something to store your backup on. If you don't have something already, I would recommend that you take a look at an external hard drive. For less than $100, you can get one that will hold 500 gigabytes or more. One of the nice things about an external hard drive is that when you're done, you can disconnect it from your computer and store it in a safe place.
To make your backup of MetaStock, all you need to do is make a copy of the Equis folder and paste it in the storage device location. If you installed your program using the default settings, you'll find it located under C:\Program Files. Locate the folder called Equis, right-click on it and choose Copy. Navigate to where you're going to place the backup folder, right-click and choose Paste.
To make a backup of your MetaStock data files, you'll find a folder called MetaStock Data located directly under your C drive. Once you find it, just right-click on the MetaStock Data folder and choose Copy. Navigate to where you want to place the backup data folder and paste it in that location. It's that easy!
To see Kevin Nelson demonstrate this lesson, just watch this three minute video.
For more MetaStock training, make sure to visit us at www.learnmetastock.com or email us at admin@learnmetastock.com.
About Kevin Nelson
Kevin Nelson is the founder of Breakaway Training Solutions, Inc. He has spent the last 17 years becoming an expert on MetaStock software and a serious student of technical while working for MetaStock. Prior to joining MetaStock in 1993, Kevin was a stockbroker for a well-known NYSE firm. In his role as Sales Manager at MetaStock, Kevin interacted extensively with MetaStock customers via phone, webinars, and public appearances. His experiences while working at MetaStock have enabled him to gain a keen understanding of the needs of technical analysts worldwide. While with MetaStock, Mr. Nelson was a featured presenter for four years. During this time, he traveled the U.S. introducing the MetaStock program to thousands of people and teaching them how to use its many features. His easy-to-understand approach is considered by many to be the best in the industry.
-
26-09-2012 01:59 PM #20
- Ngày tham gia
- Oct 2009
- Bài viết
- 1,925
- Được cám ơn 617 lần trong 428 bài gởi
Những series bài hay về phần mềm PTKT phân tích kỹ thuật MetaStock
Đây là series những bài nghiên cứu chuyên sâu về phần mềm phân tích kỹ thuật PTKT MetaStock
May - June 2011 MetaStock Monitor
The Leibovit Volume Reversal Toolkit in Action
Contributed by Mark Leibovit
As many of you know, MetaStock has just released my Leibovit VR Add-on and I’ve been asked to write a short article discussing those indicators. The Leibovit Volume Reversal add-ons are the result of 35 years of technical work and study in this industry. Old-timers may remember that I first launched the ‘Volume Reversal Survey’ newsletter way back in July 1979. In the mid-1990’s with the introduction of the internet, the Volume Reversal Survey became VRsurvey.com and later VRtrader.com. As you know, two technicians can look at the same chart and often come up with differing views. My effort here was to try and avoid such an occurrence. Fortunately, within the last 18 months I had the opportunity to work with an excellent programmer associated with MetaStock who helped me fine tune the use of my Leibovit Volume Reversal in a format that could be adapted to the MetaStock platform and which would be easy to understand and use by MetaStock subscribers. The formula for the Leibovit Volume Reversal remains proprietary, but its use and dynamics are now clearly transparent to those who wish to incorporate it in their own trading and investment strategies. The beauty of the various Leibovit Volume Reversal indicators are that they can be used in all time frames satisfying a broad-range of trader and/or investor needs. A whole new world has opened up; even very short-term traders will find opportunity in the 60 minute charts and money-managers or longer-term investors will find opportunity in the weekly and monthly charts.
This article will present three examples of the Leibovit Volume Reversal Add-On - the Leibovit VR Sequential Expert, The Leibovit VR Directional Expert, and the Leibovit VR 2 Day Expert. The Leibovit VRs are based on the premise that volume precedes price. The theory is basic and the question is always the same. Are there more buyers than sellers or sellers than buyers? When a Leibovit Volume Reversal is generated, it is anticipated the price movement will follow through in the same direction. We are not looking at a delayed indicator, we are looking at an indicator that at that moment, buyers have shifted to the plate or sellers have shifted to the plate. It is displayed as a Positive VR or a VR+ on the chart.
Let’s briefly review the theory behind each of the Add-Ons, before showing you recent examples.
Leibovit VR Sequential
The Leibovit VR Sequential expert displays all historical and current Positive VRs and Negative VRs from the market data selected. Leibovit VR signals can provide some of the best leading reversal and trend continuation signals available in the financial trading industry as well as early warning signals prior to major market moves. The Leibovit VR Sequential expert can also be utilized as a component in a trading system and allows for additional trading indicators to be applied to the same expert chart. The VR indicator can be both saved as a chart and as a custom MetaStock template should you choose to use it as part of your trading indicators. In the Leibovit VR Sequential expert, every VR on the chart is labeled; a VR+ for a Positive VR, or a VR- for a Negative VR. As shown in the next example, a number is also displayed next to each VR identifying how many successive VRs have occurred in the same direction. VRs are assigned the following numbers in sequence: 1-5 and 6+.

Chart 1
If a 6+ is displayed after the VR, it means there have been 6 or more Positive or Negative VRs in a row. While the chart will display the number as 6+, the VR Trader Sequential expert commentary will display the exact number of successive VRs in the same direction inclusive of the most current VR signal. The VR Sequential Expert will also display if the VR signal was confirmed by volume and price follow through. A follow through will be displayed on the bar immediately following the VR signal bar if both the volume increased and price moved further in the same direction as the VR. The bar immediately after the displayed VR will be colored in the same color.
Leibovit VR Directional
Leibovit VR Directional can be used alone or can be the basis for a template for use with your own trading indicators. Unlike the VR Sequential Expert which shows all successive VRs in the same direction, the Leibovit VR Directional Expert only shows a newly generated VR when it is in the opposite direction of the previous VR, or the previous VR has hit its defined stop-loss level. As long as a VR has not been stopped out, only the initial VR signal in the direction of a trend is displayed. Sequential VRs are not included in this expert. Since the Leibovit VR Directional Expert can also be utilized for trading, a feature of this expert is that stop losses are placed on the chart as well as included in the commentary. The Leibovit VR Directional Expert also presents its commentary in a trading friendly format including order placement and stop loss levels. Since the only VRs displayed by this expert are the initial VRs in a given direction, several market conditions may be more easily identified. One such condition is that of the trend reversal. These initial directional VRs confirm that shift in control from buyers to sellers or from sellers to buyers, which is the hallmark of the indicator. Intermediate term tops and bottoms are often seen after a trend has been in motion for a period of time.
Below is an example of Directional VRs generated at the beginning and end of an uptrend.

Chart 2
On the left side a Negative VR triggered a downtrend until a Positive VR was generated. Price then rallied for a period of time until a Negative VR showed that the trend had ended.
The next condition is when several opposing VRs happen in short succession, or when a tight group of VRs in the same direction keep getting stopped out in a short amount of time. These are often little bouts of time when there is a sideways channel and a breakout of the channel is trying to occur. The last VR in the group is usually the successful one, letting you know which way to watch for the breakout. The example below shows a quick succession of VRs with reversals and stops in short succession with a Positive VR at the very end which led to a channel breakout to the upside and that became the more powerful signal. During the course of the channel you can see there were a couple of trades along with a stop (the small blue stop sign on the left side of the chart) where a Positive VR did not work out. The stop said to exit the trade.

Chart 3
Leibovit VR 2 Day
While the name of the expert refers to a 2 Day concept, it really means 2 bars. It is perfectly fine to use this expert on lower or higher timeframes rather than just daily bars. The VR 2 Day expert is another VR expert that can also be used as a trading system all by itself. The principle behind this expert is simple.
When a VR is generated this expert will exit the position on one of three conditions:
1. A stop loss is triggered
2. An opposing VR occurs
3. Two trading bars have passed
The last rule is what makes this expert different as it is designed to get out of a position quickly. In fact some of the studies we have done show that on the 2 Day daily plays, a 70% reliability factor exists.
The example below shows a string of four profitable Leibovit VR 2 Day trades in a row. Each trade was entered at the open of the bar after the VR was generated and exited at the close of the following bar.

Chart 4
Because of the fast nature of this expert it allows for more positions to be entered and exited during the same time that other experts may hold on to a position that an initial VR signal generated.
When trading this expert, the 2 Day exit should be taken as close to the close of the exit bar as possible instead of waiting until the opening of the next bar. The gaps that occur between the closing and opening of bars in this expert can mean the difference between a profitable trade and a losing one.
One important point to make here is MetaStock shows only one symbol on a chart for any given bar. Because of this occasionally an exit signal will not be displayed on a chart after the two bars have passed. This happens when there is a new VR signal on the second bar after an initial VR signal. With a new VR signal occurring, it is deemed more important to chart the new VR signal than to show the exit on the chart as the new VR signal would result in the previous entry having to be exited anyway.

Chart 5
Even though the exit does not show on the chart, all of the information concerning the trade is shown properly in the expert advisory commentary which can be pulled up on your MetaStock screen.
The example below shows a string of four profitable Leibovit VR 2 Day trades in a row. Each trade was entered at the open of the bar after the VR was generated and exited at the close of the following bar.
Applying the Leibovit Volume Reversal Add-Ons to the SIVR Weekly charts
Below, is an example of the Leibovit VR Sequential, the Leibovit VR Directional and the Leibovit VR 2-Day applied to the weekly chart of SIVR (the ETFS Physical Silver Shares ETF). I chose SIVR because of the recent heightened interest in Silver and because of the strong correlation of my Leibovit VR signals to movement in the security. I chose a weekly chart to demonstrate that the applicability of my indicators are not necessarily for trading and can of great use for longer-term investors and for money managers seeking an intermediate timing tool.
In the recent strong Silver market, it can be legitimately argued (in hindsight) that a buy and hold strategy would have made more sense than any trading system or discipline. That said, both the Leibovit VR Sequential and the Leibovit VR Directional have caught the lion share of the recent move, while the Leibovit VR 2-Day did exactly what it was supposed to do – get you out with a quick trade in two bars!
SIVR WEEKLY LEIBOVIT VR SEQUENTIAL:

SIVR WEEKLY LEIBOVIT VR Directional:

SIVR WEEKLY LEIBOVIT VR 2-Day:

Back to top
Support Tip
How do I get Greeks in QuoteCenter?
Contributed by MetaStock Support
For QuoteCenter Only
Have you ever wondered why the Greeks are so important for options traders? Well, the Greeks tell traders how much risk their option positions have.
There are many ways of estimating the risks associated with options, such as the risk of the stock price moving up or down, implied volatility moving up or down, or how much money is made or lost as time passes. These risks are determined through mathematical formulas collectively known as the "greeks", because most use Greek letters as names. Each greek estimates the risk for one variable: delta measures the change in the option price due to a change in the stock price, gamma measures the change in the option delta due to a change in the stock price, theta measures the change in the option price due to time passing, and vega measures the change in the option price due to volatility changing.
Here's how you can look up the Greeks in QuoteCenter:
1. Open a new workspace by going to "File", then "New Blank Workspace".

2. Double click anywhere in the new workspace.
3. Select OptionWatch and click "OK".

4. Double click again in the white space and select Analytics. Click "OK".

5. Click on the chain icon or go to "Edit", then "Add/Delete Visual Link" from the tool bar.

Chain Link

Edit - Add/Delete Visual Link
6. You pointer should have a little chain link at the bottom. Click the black area of the OptionWatch window, hold, and drag it to the Analytics1 window.
7. When asked what kind of link you want to create select "Display Analytics Page". Click "OK".

8. When asked "What parameters do you wish to use?" select or enter "/T".
9. In the OptionWatch window, type in your ticker symbol and hit enter.
9. Click on any green or red symbols in the OptionWatch window. These are the options contracts currently active. Double clicking will display all of the Greeks for the selected option in the Analytics window. The Greeks will appear in the bottom right hand corner.

Back to top
MetaStock Power User Tip
Creating a Custom Watch List
Contributed by Breakaway Training Solutions
In this six minute video, you’ll learn how to create your own watchlist of securities using MetaStock’s Favorites folder. You’ll also discover how to modify the list of securities, add multiple securities at one time and scroll through your favorite charts quickly to find buy and sell signals. Have a look!
http://www.learnmetastock.com/FreeSt...rkingWith.html
For more MetaStock training, make sure to visit us at www.learnmetastock.com or email us at admin@learnmetastock.com.
About Kevin Nelson
Kevin Nelson is the founder of Breakaway Training Solutions, Inc. He has spent the last 17 years becoming an expert on MetaStock software and a serious student of technical while working for MetaStock. Prior to joining MetaStock in 1993, Kevin was a stockbroker for a well-known NYSE firm. In his role as Sales Manager at MetaStock, Kevin interacted extensively with MetaStock customers via phone, webinars, and public appearances. His experiences while working at MetaStock have enabled him to gain a keen understanding of the needs of technical analysts worldwide. While with MetaStock, Mr. Nelson was a featured presenter for four years. During this time, he traveled the U.S. introducing the MetaStock program to thousands of people and teaching them how to use its many features. His easy-to-understand approach is considered by many to be the best in the industry.Last edited by tigeran; 26-09-2012 at 02:03 PM.


 Trích dẫn
Thông tin của chủ đề
Users Browsing this Thread
Có 1 thành viên đang xem chủ đề này. (0 thành viên và 1 khách vãng lai)
Similar Threads
-
Những series bài hay về phần mềm phân tích kỹ thuật AmiBroker
By tigeran in forum Phân tích kỹ thuật AmiBrokerTrả lời: 37Bài viết cuối: 15-11-2016, 04:27 PM -
Phần mềm phân tích kỹ thuật
By waterloo1815 in forum CLB Chứng khoánTrả lời: 2Bài viết cuối: 28-10-2009, 11:32 PM
 Quyền viết bài
- Bạn Không thể gửi Chủ đề mới
- Bạn Không thể Gửi trả lời
- Bạn Không thể Gửi file đính kèm
- Bạn Không thể Sửa bài viết của mình

Bookmarks