

Threaded View
-
12-09-2012 02:27 PM #10
- Ngày tham gia
- Aug 2010
- Bài viết
- 648
- Được cám ơn 325 lần trong 218 bài gởi
 Những series bài hay về phần mềm phân tích kỹ thuật MetaStock
Đây là series những bài nghiên cứu chuyên sâu về phần mềm PTKT phân tích kỹ thuật MetaStock
A New Look At A Decades-Old Tool
Contributed by Don Fishback
There's been a lot of talk lately about models, probability and statistics. The reason is manifold, but it all distills down to what's going on in the banking and financial sector. You see, nearly every major decision in national and global-scale finance - whether it was the ability of a group of borrowers to pay back loans, the amount of capital banks were required to keep, the amount of collateral required to provide credit default insurance, or the value of certain derivatives - is based on a probability model.
A contemporaneous example is the so-called "bank stress test". Regulators disclosed the methodology for the stress test in late April. In that disclosure, they said, " of [commercial and industrial] loan loss projections was based on the distribution of exposures by industry and by internal rating provided by the firms. In many cases, these ratings were mapped to default probabilities by the firm; in other cases, this association was established by supervisory analysts. This information was confirmed and supplemented by external measures of risk, such as expected default frequencies from third party vendors. Supervisors evaluated firm loss estimates using a Monte Carlo simulation that projected a distribution of losses by examining potential dispersion around central probabilities of default."
A Monte Carlo simulation works by randomly generating inputs going into a model (or formula or equation), and then evaluating all the results. The first step in the process of using a Monte Carlo simulation requires that you create the model. Obviously, that's important. The second part is equally important. It requires you to answer this question: How do you generate the random numbers? To do that, you need to select a "domain" or "distribution". There are many different types of distributions out there: uniform, binomial, triangle, etc. One of the most widely used, and the one that is used in the financial arena more than any other, goes by several different names: Gaussian, normal or bell-curve.
In finance, we typically add a complication, and that is to express movements in terms of logarithms. Personally, I like to keep things simple, so I would hesitate to add anything making it more difficult. But the addition of the logarithm does have a purpose. The reason we express movement in terms of logarithms as opposed to percentages is because a 50% loss and a 50% gain are not necessarily the same thing. Think of a stock at 100. If it loses 50% and then gains 50%, the stock goes from 100 down to 50 up to 75. Instead, a 50% loss and a 100% gain are the equal-magnitude inverse of each other. If the stock goes down 50%, then up 100%, then the path is from 100 down to 50 and back to 100. You get the same result if the path reverses going up 100% first then down 50%. The stock starts at 100, then up to 200, then back down to 100. The net of all of this is that the natural logarithm of 0.50 (-0.69315) is the inverse of the natural logarithm of 2.00 (+0.69315).
Now back to the bell curve that is used in financial Monte Carlo simulations and derivative pricing. One of the interesting properties of the bell curve is that it gives us the ability to calculate probabilities, as shown in the following graph:
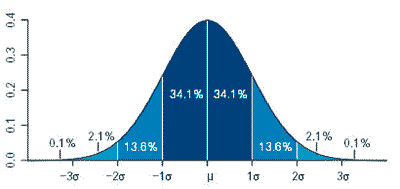
x-axis is expressed in terms of standard deviation. Graph produced using R by Jeremy Kemp
As you can see, there are certain probabilities associated with different standard deviations. That's important, because standard deviation is associated with something else that we as traders are well aware of: volatility. You see, volatility is equal to the annualized standard deviation of the asset.
That means, if we know an asset's volatility, we can use certain formulas to calculate probability.
That's where the ODDS Probability Cone, developed over a decade ago, comes in. This indicator -- unique to MetaStock -- has those formulas built into it, allowing you to easily visualize probability.
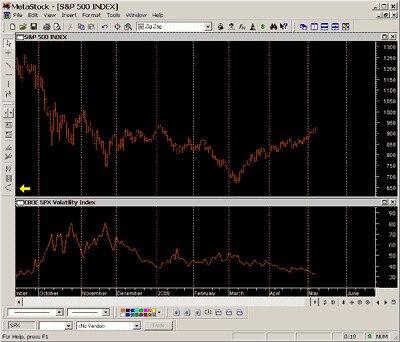
Below is a chart of the S&P 500 Index plotted with the CBOE Volatility Index (VIX). The VIX is a measurement of expected volatility of the S&P 500 Index over the next 30 days. That expectation is implied by the prices of S&P 500 Index options. Also shown in the chart is a yellow arrow pointing to a parabolic shape in the Line Studies toolbar. That's the ODDS Probability Cone.
If you click on the parabola, your cursor becomes a cone-shaped indicator that you can move across the chart. Simply move the indicator to where you want to do the , and you're ready to set the parameters, as shown in the next graphic.
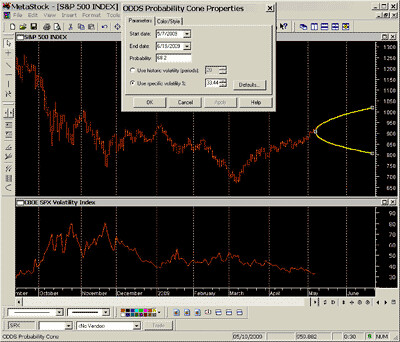
Once you've placed the cone where you want it, simply double click it and see the dialog box that allows you to set the dates, the probability and the volatility. In this particular instance, I set the date from May 7 to the June options expiration, June 19. I set the volatility to the specific value of the VIX that day. And I set the probability to 68.2% -- the level corresponding with +/- 1 standard deviation. Once I've set the parameters, MetaStock performs the calculations I created, and the ODDS Probability Cone (shown in yellow) is drawn. By scrolling across the indicator, you can get the Cone values at different points in time, as shown in the next graph.
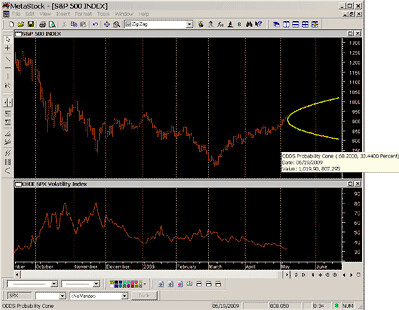
As you can see, when the cursor is placed on the Cone at 06/19/2009, the values are 1019.90 and 807.295. That means, based on an expected volatility of 33.44, there is a 68.2% chance that the index will be in between those two values on that date, which is when the June options expire. There is a 31.8% chance the index will be outside that range on June 19.
Not only can we look at 68.2/31.8, the probabilities associated with +/- 1 standard deviation, we can look at other probabilities as well. For example, we can look at 50/50 (green), 80/20 (blue), or 90/10 (orange).
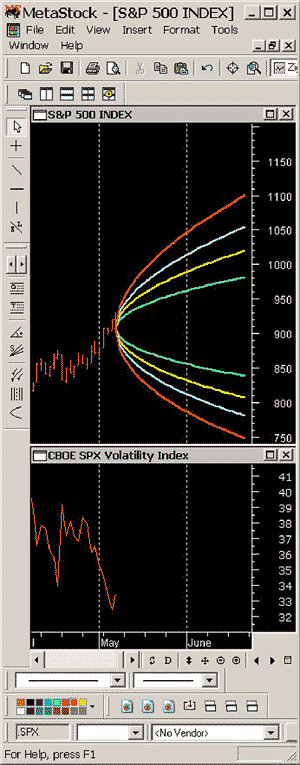
To option traders, this provides vital information, as it allows us to visualize the expected probability of a certain-size market movement. By looking at this chart, we can see that the market is expecting a 90% chance the S&P 500 will be within 750 and 1100 at June options expiration.
So when you look at all that's going on in the banking and the markets today, with the stress tests and the attempts at pricing derivatives, realize that one of the tools those folks are using is built into MetaStock so you too can determine probabilities quickly, easily and visually.
-- Don Fishback
A couple of caveats: First, this is a simplified explanation meant to highlight the major factors and the features of the indicator. A more comprehensive explanation requires a lot more math, and this simply isn't the forum for that discussion. Second, the formulas used to calculate the ODDS Probability Cones are based on the assumption that the stock market follows a logarithmic, normal distribution. No asset actually follows that distribution perfectly. But it is a useful representation when applied to an asset class such as a broad-based stock index. Just remember these words from statistician George Box, "All models are wrong, but some are useful."
ODDS(r) is a registered trademark of Donald M. Fishback, Jr.
About the Author - Don Fishback is the creator of ODDS® – Options and Derivatives Decision Support. ODDS is a method for analyzing options and other derivatives based on a unique method for balancing risk, reward and probability. The key to this approach is volatility, which is the way most people look at options, plus magnitude over time. Don’s oddsonline.com software provides traders with his unique Measure, Don’t Model™ tools. Not only does ODDS Online calculate probabilities based on the most commonly used option pricing models, but it also incorporates actual measurements of stock price movement to evaluate option strategies. A 25 year veteran of the derivatives business, Don spent many years on the conference and lecture circuit. Now he prefers to spend his time at home with his family.
Back to top
Support Tip
How can I restore the back-up copy of my custom formulas?
Contributed by Equis Support
How can I restore the back-up copy of my custom formulas?
Open MetaStock
Click Tools | Indicator Builder
Click Organizer
Select "Import formula files", then click Next
Specify the location you wish to import the files from
Click Finish
All of the formula files, experts, explorations, and system tests will be read from and added to the current installation location for MetaStock.
If you already have formulas, experts, explorations, and system tests of the same name in MetaStock, you will be asked if you want to replace them. If you say yes, the import will finish, overwriting the formulas of the same name. If you say no, the import will be halted and no custom formulas will be restored.
Back to top
MetaStock Features
Fire Plug-In
Contributed by Ken Spelman
One of our best plug-ins for broad market is also one of the least understood; Fire. Fire is a tool that allows you to calculate and plot breadth indicators on sectors and industry groups rather than the market as a whole. A breadth indicator is a specific type of indicator using advancing and declining issues to determine the amount of participation in the movement of the stock market.
Fire allows you to perform External Relative Strength (also known as ERSA). ERSA is a concept that measures how a stock’s price has performed versus all other stocks in the selected group over a specific time frame. Fire allows you to customize your by choosing the stocks you group together to calculate an array of breadth indicators over any time period. You can then plot your results in MetaStock for more .
Fire is the only program that will allow you to easily create your own custom index. With Fire’s custom indices tool, you’ll get quick calculations on the average open, high, low and close of all the securities in the folder you create.Last edited by tradingpro8x; 18-09-2012 at 08:35 AM.


 Trích dẫn
Thông tin của chủ đề
Users Browsing this Thread
Có 1 thành viên đang xem chủ đề này. (0 thành viên và 1 khách vãng lai)
Similar Threads
-
Những series bài hay về phần mềm phân tích kỹ thuật AmiBroker
By tigeran in forum Phân tích kỹ thuật AmiBrokerTrả lời: 37Bài viết cuối: 15-11-2016, 04:27 PM -
Phần mềm phân tích kỹ thuật
By waterloo1815 in forum CLB Chứng khoánTrả lời: 2Bài viết cuối: 28-10-2009, 11:32 PM
 Quyền viết bài
- Bạn Không thể gửi Chủ đề mới
- Bạn Không thể Gửi trả lời
- Bạn Không thể Gửi file đính kèm
- Bạn Không thể Sửa bài viết của mình

Bookmarks